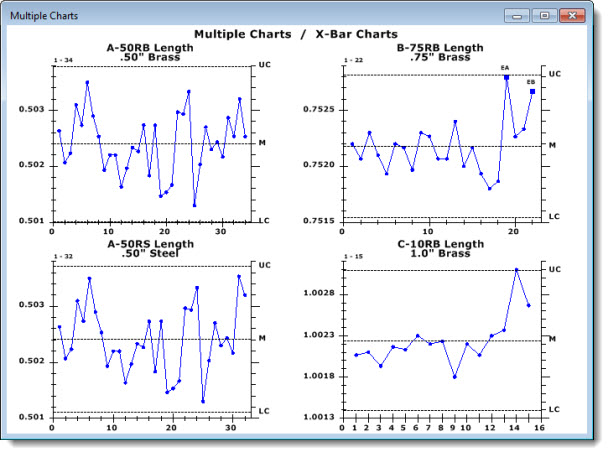
Summary charts feature up to 49 retrievals all in one chart window.
GainSeeker SPC Summary charts include these chart and table types:
When you generate any of the charts listed above, GainSeeker uses the Date Period and Filter from the Settings tab to determine which of the selected SPC standards have data for that date period and filter, and then it uses that data to draw the charts.
After this chart is drawn, any changes or updates will be limited to the SPC standards that originally returned data when you first created the chart. These changes and updates include:
changing the Date Period or Filter for the chart family
refreshing the chart family to re-retrieve the data
storing the chart family in a desktop and opening that desktop
If you selected a long list of standards - e.g., for viewing on a Statistics Table or Monitor Table - performing these changes or updates can prevent some standards from being displayed on the chart, even though they now have data that matches your retrieval settings.
One way to avoid this issue is to generate the initial chart in a way that all the standards you selected will return some data - for example, with no Filter, a Date Period of "All Dates", and Maximum count for retrieval = 1 - and then change these three Settings on that chart to reflect the data you actually want to see. Subsequently changing the chart settings, refreshing the chart, and storing the chart in a desktop will all retain the original standard selections.
When opening a desktop, you can always ensure that the desired standards are being analyzed by Opening the Desktop with Changes and specifying different SPC standards.