The SPC Charts and Reports module allows you analyze data for your processes and generate charts and reports for this data.
To generate charts and reports to analyze your data, launch the SPC Charts and Reports module and log in.
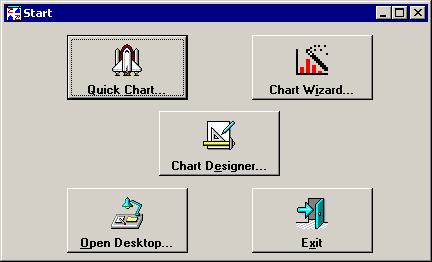
After logging in, the following screen will help you start analyzing data and generating charts and reports:

Choose the option that best fits your needs:
Chart Wizard
If you are new to GainSeeker SPC, Chart Wizard can help you become more familiar with the program. Chart Wizard displays easy-to-follow, step-by-step instructions to helps you to create charts and reports.
For more information, see Using the Chart Wizard.
Quick Chart
Quick Chart contains all of the options presented in Chart Wizard, but it requires fewer steps to set those options.
For more information, see Using Quick Chart.
Chart Designer
This offers more sophisticated charting and analysis options such as multiple date ranges, multiple filters, or a statistical filter.
For more information, see Using Chart Designer.
Open Desktop
If you have already stored a set of charts and reports as a Desktop, you can use Open Desktop to retrieve those charts and reports.
For more information on Desktops, see Storing a group of charts as a Desktop.
You can also perform paired sample analysis to identify correlations between two variables in your process.
To begin a paired sample analysis, click the File menu, and then select Paired Sample Analysis.
For more information, see Creating a Paired Sample Chart.
You can also perform these and other functions from the Charts and Reports Toolbar.
You may want to customize which buttons appear on this Start screen, or even configure one of these options to open immediately when you launch the SPC Charts and Reports module. To do so, click the Desktop menu, and then click Define Start Buttons.