 Note:
Multiple Charts settings and all other settings located in the Chart overrides
node of the Settings dialog can be saved as a chart skin that you can
apply to any charts. For more information, see Chart
Skins
Note:
Multiple Charts settings and all other settings located in the Chart overrides
node of the Settings dialog can be saved as a chart skin that you can
apply to any charts. For more information, see Chart
SkinsSet options for multiple-type charts, such as a combined charts.
|
Contents [Hide] |
You can choose default settings for charts in the GainSeeker System Administration module. See Chart Defaults settings
Note:
Multiple Charts settings and all other settings located in the Chart overrides
node of the Settings dialog can be saved as a chart skin that you can
apply to any charts. For more information, see Chart
Skins
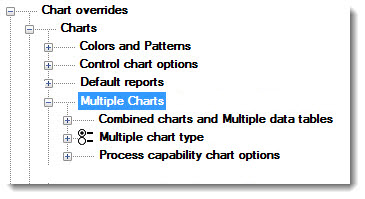
Navigate to Multiple Charts options by following this path on the Settings tab:
Chart overrides | Charts | Multiple Charts
See Navigating tree structures for help with navigating tree structures like the one featured on the Configurations tab.
Use the Combined charts and Multiple data tables options to set retrieval options for Combined Control Charts and Multiple Data Tables. Click an option to expand it and display more options.
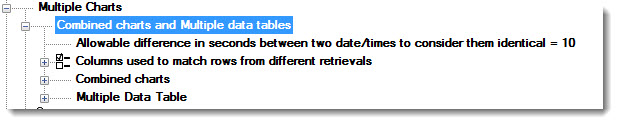
Change the maximum time interval GainSeeker uses to match the data points of two or more standards on a Combined Control Chart or a Combined Data Table. Data records from different retrievals are ordered by how close the date/time stamps of each fall in relation to each other. By default, date/time stamps that fall within 10 seconds of each other are considered identical.
The date/time stamp displayed on each row of a Multiple Data Table is the actual date/time stamp of the first (left-most) data subgroup displayed on that row. The date/time stamps of the remaining subgroups displayed on that row may match exactly, or they may fall within the specified time period.
Navigate to the Allowable difference in seconds between two date/times to consider them identical setting by following this path on the Settings tab:
Chart overrides | Charts | Multiple Charts | Combined charts and Multiple data tables | Allowable difference in seconds between two date/times to consider them identical
The Set Value dialog opens.
Using seconds as the time increment, enter a numeric value that represents a time interval for GainSeeker to use.
See Setting the time interval to match the data points of two standard on a Combined Control Chart for more information.
The default setting GainSeeker uses to consider retrievals identical can also be changed in the GainSeeker Administration module.
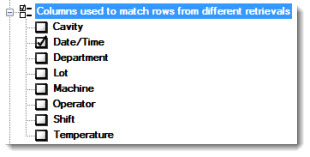
Select one or more traceability column labels that are common among the standards selected for the retrievals. GainSeeker uses these columns to match the rows for the retrievals on a Multiple Data Table. The default setting is Date/Time.
Navigate to this setting by following this path on the Settings tab:
Chart overrides | Charts | Multiple Charts | Combined charts and Multiple data tables | Columns used to match rows from different retrievals
For more information on See matching data records
These options only apply when the Combined Control charts type is selected on the Charts tab.
Navigate to Combined charts options by following this path on the Settings tab:
Chart overrides | Charts | Multiple Charts | Combined charts and Multiple data tables | Combined charts
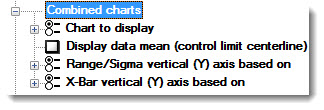
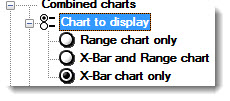
Chart to display
Select the plot to display on a Combined Control Chart. Click an option to select it.
Display data mean (control limit centerline)
Display a line for the data mean for each standard on a Combined Control Chart. The lines are color-coded to each standard and labeled with an M as shown in this example:
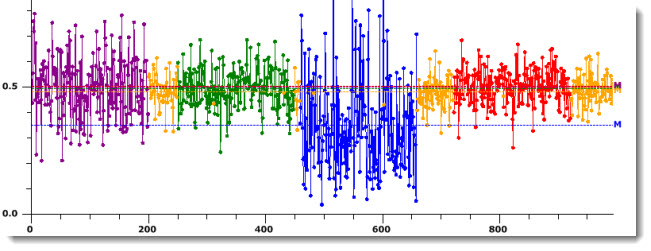
Select the checkbox preceding this option to display the data
lines for the mean.![]()
Range/Sigma vertical (Y) axis based on
See Scaling Combined Control Charts to show more detail for more information about using this and the X-Bar vertical (Y) axis based on setting.
To normalize the data on a Combined Control Chart:
Select on what the Y-axis plot is to based for a range or sigma chart.

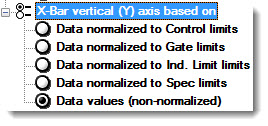
X-Bar vertical (Y) axis based on
See Scaling Combined Control Charts to show more detail for more information about using this and the Range/Sigma vertical (Y) axis based on setting.
To normalize the data on a Combined Control Chart:
Select on what the Y-axis plot is to be based for an X-bar chart.
These options only apply when the Multiple Data Table chart type is selected on the Charts tab.
Navigate to Multiple Data Table options by following this path on the Settings tab:
Chart overrides | Charts | Multiple Charts | Combined charts and Multiple data tables | Multiple Data Table
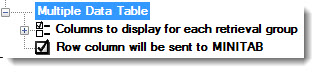
Columns to display for each retrieval group
Only the individual data value columns are displayed for each retrieval group by default However, you configure GainSeeker to display any combination of individual data values, subgroup range, and subgroup average (X-bar).
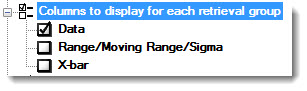
Each retrieval group can display columns for individual data values, the subgroup average (X-bar), and the subgroup range. If the standard for a retrieval group is configured to display a moving range or sigma instead of a subgroup range, this information is automatically substituted for the subgroup range on a Multiple Data Table.
Row column will be sent to MINITAB
When you send a Multiple Data Table (or any other chart from the One window for all (multiple retrievals) list) to MINITAB, GainSeeker will send the Row column (the column that numbers the table rows) with this item selected (the default setting). In the following example, the Row column has been highlighted in yellow for diagramming purposes:
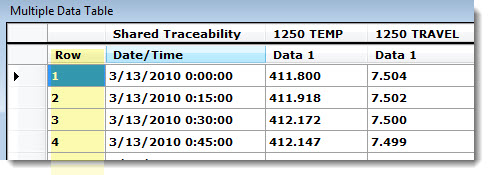
To send the table to MINITAB without the Row column, clear the Row column will be sent to MINITAB check box.
![]() Note: If you
will send the chart to MINITAB
via COM, this check box must
be selected so that the Row column
is sent to MINITAB and the commands function correctly.
Note: If you
will send the chart to MINITAB
via COM, this check box must
be selected so that the Row column
is sent to MINITAB and the commands function correctly.
These options apply only when the Multiple Chart type is selected on the Charts tab.
Navigate to Multiple Chart type options by following this path on the Settings tab:
Chart overrides | Charts | Multiple Charts | Combined charts and Multiple data tables | Multiple Chart type
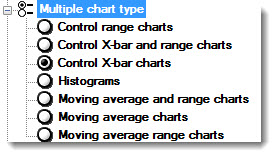
Select the type of chart that will display for each standard within a single chart window.
Click Multiple chart type to display the options. Then click a chart type to select it.
These options only apply when the Process Capability chart type is selected on the Charts tab.