Charts visually communicate information about numerical relationships that might otherwise be lost in mounds of data. The GainSeeker Charts module offers more versatile options for charting to help you analyze process data.
GainSeeker SPC charts and DMS charts offer a multitude of display and retrieval features, only a few of which are described here.
Store SPC charts, DMS charts, dashboards, and notes together as a retrievable Desktop that is easy to create and use.
With just a few clicks, you can send an image of a chart to a Microsoft PowerPoint presentation, Microsoft word document, email, or save it as a file.
Performance charts help define process capability using quartiles by grouping data by a traceability value. This allows for quick visual comparison of data groups by mean and variation.
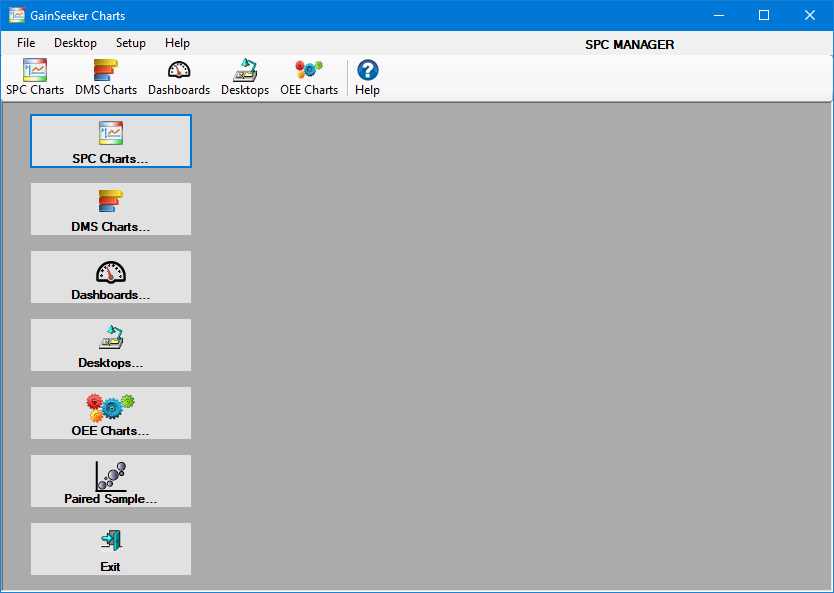
First, open the LaunchPad. Then, click the GainSeeker Charts button to launch the GainSeeker Charts module. This also opens the GainSeeker Charts window (shown below) where analysis begins. See The GainSeeker Charts window: An overview
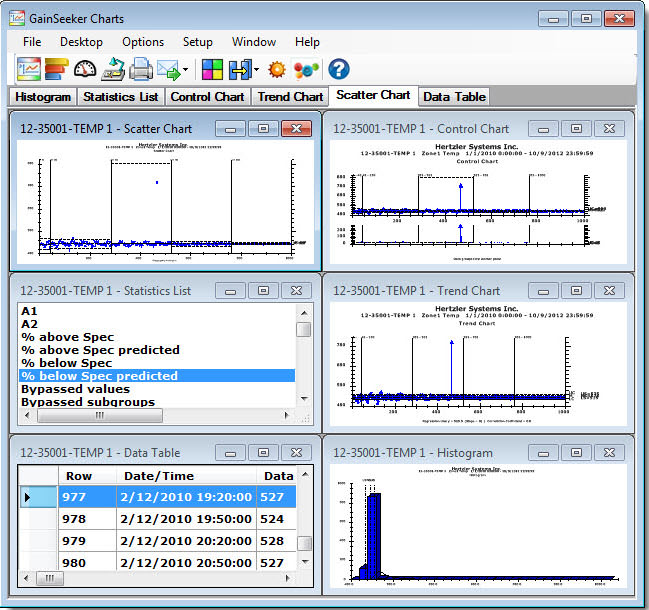
Following is an example of GainSeeker charts open on the GainSeeker Charts window, which serves as the backdrop for all of your analysis. These charts have been stored together as a desktop that can be opened again and again.