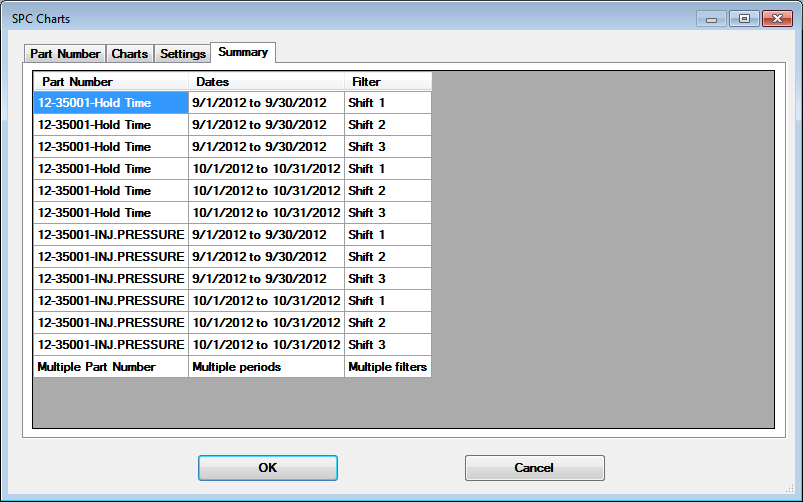
The Summary tab on the SPC Charts dialog summarizes your selections for the retrievals. It also provides a visual indication of the number of retrievals you have selected to generate charts, but not necessarily an indication of the number of charts. The Summary tab can be useful when you are grouping data using multiple filters, part numbers, or date ranges.
A chart that features multiple retrievals in one chart window (Multiple Charts, Process Capability, Statistics Table, Multiple Data Table, and Combined Control charts) will list as one chart, regardless of the number of retrievals it may contain. For more information, see Multiple Retrievals.