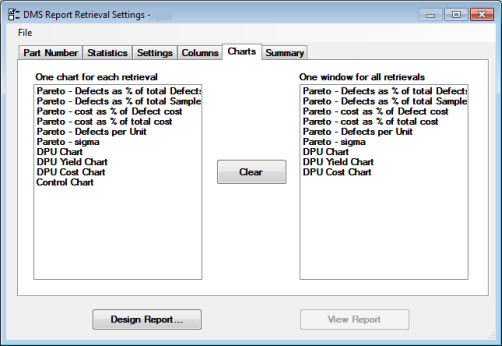
Use the Charts tab on the DMS Report Retrieval Settings dialog box in Dynamic Reports to choose which types of charts to generate for the report.
The charts selected on the Charts tab will apply to all the standards (or part numbers) you selected on the Part Number tab.
The available DMS charts fall into two basic categories: the One window for each retrieval list and the One window for all retrievals list. See Selecting charts for retrievals in this topic:
|
One window for each retrieval group |
One window for all (multiple retrievals) |
|
See PARETO CHARTS for information about the following Pareto chart types |
See PARETO CHARTS for information about the following Pareto chart types |
|
Pareto - Defects as % of total Defects |
Pareto - Defects as % of total Defects |
|
Pareto - Defects as % of total Sample |
Pareto - Defects as % of total Sample |
|
Pareto - cost as % of Defect cost |
Pareto - cost as % of Defect cost |
|
Pareto - cost % of total cost |
Pareto - cost as % of total cost |
|
Pareto - Defects per Unit |
Pareto - Defects per Unit |
|
Pareto - sigma |
Pareto - sigma |
|
|
|
|
See DPU CHARTS for information about the following DPU chart types |
See DPU CHARTS for information about the following DPU chart types |
|
DPU Chart |
DPU Chart |
|
DPU Yield Chart |
DPU Yield Chart |
|
DPU Cost Chart |
DPU Cost Chart |
|
|
|
|
See CONTROL CHARTS for information about Control charts |
|
|
Control Chart |
|
To |
Select from |
Example |
|
Create a separate chart for each standard selected on the Part Number tab: |
The One window for each retrieval list. |
If you select two part numbers on the Part Number tab, and you select Pareto, you will create two Pareto charts—one for each standard—on separate windows. If you select two standards on the Part Number tab, and you select both Pareto and DPU Chart from the One window for each retrieval list, you will create four charts—a Pareto and a DPU Chart for each standard. |
|
Create one chart analyzing all standards selected on the Part Number tab: |
The One window for all retrievals list. |
If you select five part standards on the Part Number tab, and you select a Pareto chart from the One window for all retrievals list, you will create one Pareto chart window analyzing data from all five part numbers. |
|
Create a separate chart for each standard and one chart analyzing all standards selected on the Part Number tab: |
The One window for each retrieval list and the One window for all retrievals list. |
If you select three standards on the Part Number tab and select a DPU Chart from the One window for each retrieval list and a Pareto chart from the One window for all retrievals list, you will create four chart windows—a DPU Chart for each standard and one Pareto chart analyzing all three standards. |