Monitoring Failures
|
 Note: This topic contains information about the legacy SPC Database Monitor module, which is being phased out from GainSeeker Suite. It is still available for use, but is being replaced by the Monitor Table chart window in the newer GainSeeker Charts module. Note: This topic contains information about the legacy SPC Database Monitor module, which is being phased out from GainSeeker Suite. It is still available for use, but is being replaced by the Monitor Table chart window in the newer GainSeeker Charts module.
|
The Failure Monitor logs data records that violated SPC rules, gate limits or specification limits during data entry. You can use this list to find out which processes are generating SPC failures and to log corrective action and summary information.
Starting the Failure Monitor

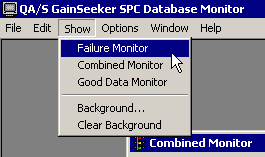
In , click the Window (or Wnd) menu, point to Show, and then click Failure Monitor.
Understanding the Failure column
The Failure Monitor displays a table of data records with real-time failures. In this table, the Failure column will display one or more of the following failure codes:
|
Symbol
|
Failure
|
|
C
|
Control Limit failure
|
|
S
|
Specification Limit failure
|
|
G
|
Gate Limit failure
|
|
R
|
Run failure
|
|
T
|
Trend failure
|
|
Z
|
Zone failure
|
|
Q
|
CuSum failure
|
|
I
|
Individual limit failure
|
The reasons associated with these failure codes are also listed in the status bar at the bottom of the screen. (In PDA mode, the status bar is not displayed.)

Managing the number of records shown in the Failure Monitor
The Failure Monitor keeps track of ALL real-time failures in your database, so it grows over time as you collect data. To keep the list at a manageable size, you can regularly purge old records from the list or choose which monitor records to display.
More:
Performing corrective action on failures
Launching the SPC Database Monitor
Monitoring Your Database
 Note: This topic contains information about the legacy SPC Database Monitor module, which is being phased out from GainSeeker Suite. It is still available for use, but is being replaced by the Monitor Table chart window in the newer GainSeeker Charts module.