A Control Chart is one of the most commonly used tools for basic process control because it can help distinguish between common cause and special cause variations.
|
Contents [Hide] |
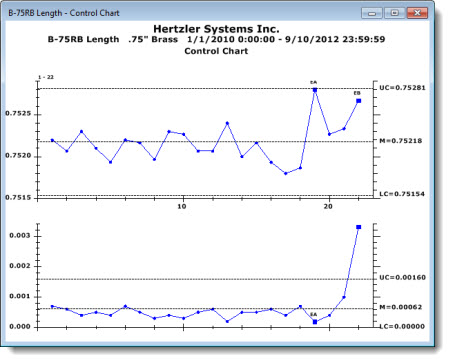
The Control Chart can be displayed in different ways:
Subgrouped data is typically shown as an X-Bar and R Chart (see example above).
The top chart plots the subgroup averages
(![]() )
and the bottom chart plots the range of each subgroup (R).
)
and the bottom chart plots the range of each subgroup (R).
For individuals data (data with a subgroup size of 1), this is typically shown as an X and MR Chart.
The top chart plots the individual data points (X) and the bottom chart plots the "moving" range between previous data point and the current data point (MR).
For either subgrouped or individuals data, a sigma chart can be displayed as the bottom chart.
You can use a simple technique called "data brushing" to select any number of consecutive data points on a chart. Then, select from options that allow you to focus on just that data or to exclude it from the retrieval.
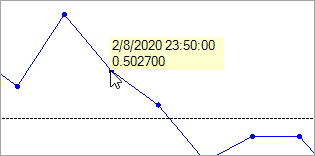
You can click any data point or limit line to display its value.
Depending on how your GainSeeker is configured, certain access rights may be required to use this function.
For more information, see Editing an SPC data record.