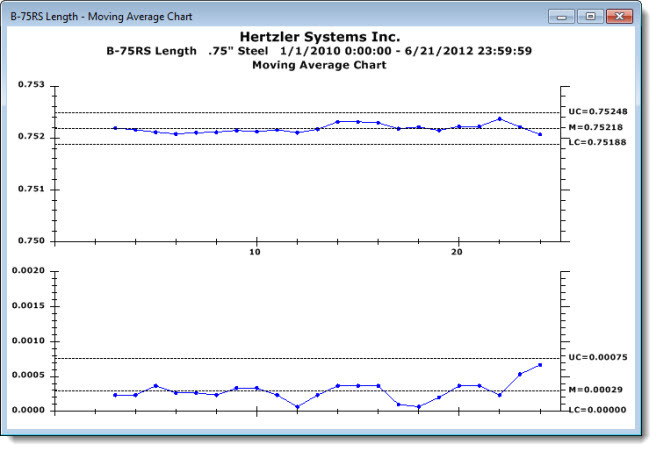
A Moving Average chart gives a good representation of batch processes by letting you examine the influence of prior data points on a current sample. It allows you to smooth data, normalizing the effects that an out-of-control spike will have on a data set by averaging two or more consecutive data points.
|
Contents [Hide] |
Note: Data brushing is not available on a Moving Average chart
See Chart Settings options for information on changing the display elements of this chart.
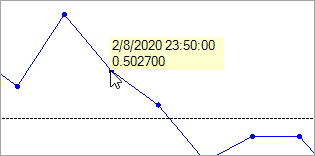
You can click any data point or limit line to display its value.
Depending on how your GainSeeker is configured, certain access rights may be required to use this function.
For more information, see Editing an SPC data record.