 Note: Performance chart settings and all other settings located in the Chart overrides node of the Settings dialog can be saved as a chart skin that you can apply to any charts. For more information, see Chart Skins
This topic details the Performance Chart options on the Settings tab tree.
You can assign default settings to charts in the GainSeeker System Administration module. See Chart Defaults settings
 Note: Performance chart settings and all other settings located in the Chart overrides node of the Settings dialog can be saved as a chart skin that you can apply to any charts. For more information, see Chart Skins
|
Contents [Hide] |
Navigate to Performance charts by following this path on the Settings tab:
Chart overrides | Charts | Performance charts
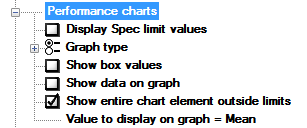
When you display the lines for specification limits on a Performance Chart, you can choose whether or not to display the values of those limits at the right-hand edge of those lines.
To display specification values from the standard, select this checkbox.
To avoid displaying specification values, clear this checkbox.
To change the default for this setting in the GainSeeker Administration module, see SPC Chart default settings.
|
Performance Chart |
Data Display |
|
Box and Whisker |
Draws minimum and maximum values, first and third quartiles and the mean. |
|
Box chart |
Draws upper and lower control limits and the mean. |
|
Centered Box chart |
Shows how the Box chart (above) would look if centered on the Nominal Spec. |
|
Histogram |
Draws normal and non-normal curves based on the distribution. When a data curve does not display a line for the mean, it indicates non-normal data. |
To change the default chart type in the GainSeeker Administration module: see Changing the default chart type.
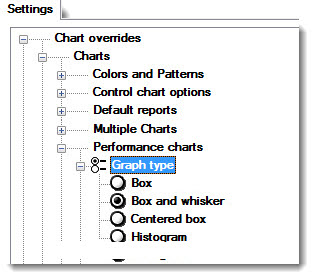
To change the graph (chart) type of a new or an existing chart:
Expand the Graph type node.
Then, click a Graph type to select it. Box and Whisker is shown selected in the following example.
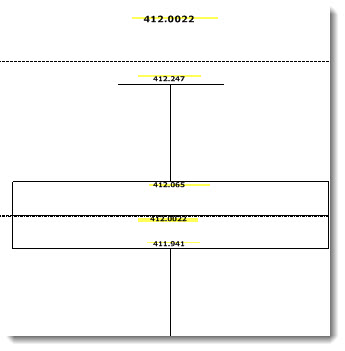
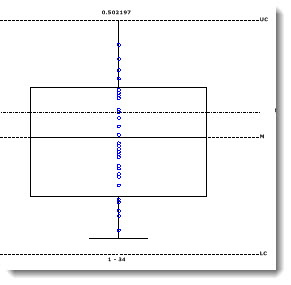
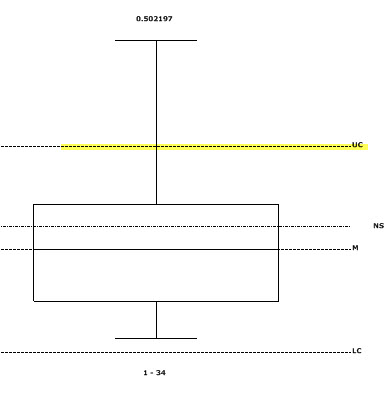
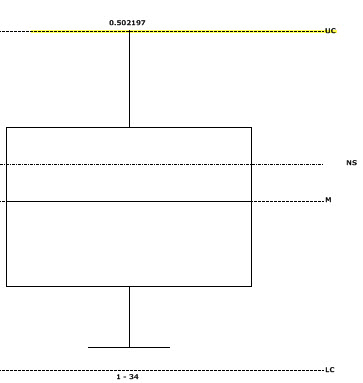
Determines whether the data illustration can be displayed beyond the limit lines (such as control limits) and the Y-axis scaling in the SPC standard or in the Standard Overrides.
To allow the illustration to continue past the limit lines, select this check box.
To display only the data within the limit lines, clear this check box.
Following are examples showing this option selected and not selected (the default setting). The upper control limit in both examples has been highlighted for diagramming purposes.
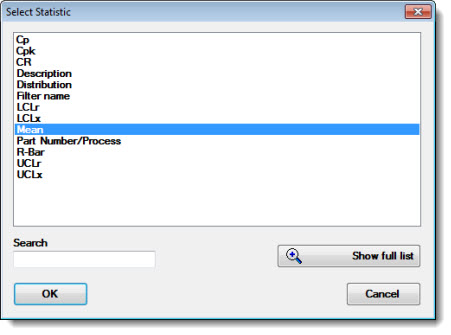
Sets the statistic or value to display on the chart when this option is selected.
The Select Statistic dialog opens.
Click a statistic to select it for the chart. Then, click OK.
Select a statistics report to display under a Performance chart when this option is selected.
 To display statistics under a chart on your screen, the Show statistics list under chart option must be selected on the Settings tab.
To select the statistics that display:
Chart overrides | Charts | Default reports | Statistics under performance chart |
Then, Double-click Statistics under performance chart.
The Statistics under performance chart dialog opens. See Using Select Statistics dialogs
Also see Choosing Limits to Display