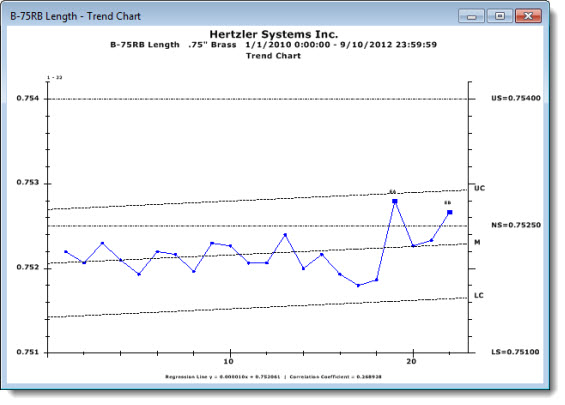
Similar to the Scatter Chart, a Trend Chart plots data points to detect trends. Control limits and the mean are calculated from the linear regression line. Knowing the trend of a process can help to predict when the process may run outside gate limits or specifications.
|
Contents [Hide] |
See Chart Settings options for information on changing the display elements of this chart.
You can use a simple technique called "data brushing" to select any number of consecutive data points on a chart. Then, select from options that allow you to focus on just that data or to exclude it from the retrieval.
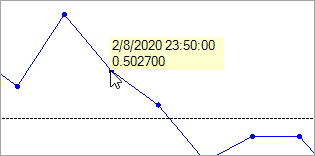
You can click any data point or limit line to display its value.
Depending on how your GainSeeker is configured, certain access rights may be required to use this function.
For more information, see Editing an SPC data record.