Dashboard controls on a dashboard window in run mode feature right-click menu options that may differ depending on the type of control. A few of the less complex controls display the same right-click menu options in run mode as that of the host dashboard.
Dashboard controls on a dashboard in design/edit mode do not display right-click menus independent from the dashboard.
Note: The HTML dashboard control on a dashboard in run mode displays a Microsoft Internet Explorer right-click menu. Refer to Internet Explorer for documentation relevant to this topic.
|
Contents [Hide] |
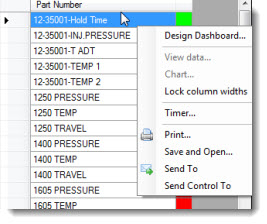
Right-click on a dashboard control on a running dashboard and then click an item on the menu that displays to select it. Following is the right-click menu for a Dashboard Grid. Menu options may vary depending on the type of dashboard control.
Converts the data, settings, and chart skin from the dashboard control into the chart type you select. If you edit or delete data from the chart, those changes will not be reflected on the dashboard until it is re-opened or refreshed.
Design Dashboard...
Legend...
Print...
Opens the Print dialog where you can set printing properties and print.
Save and Open...
Takes a screen capture (or "snapshot") image of the item. The file opens after it is manually saved to a user-specified file.
Send Control To
Sends a copy of the dashboard control image or display values (text only) to a user-selected program or application, or saves it as a file.
Send To
Sends a copy of the dashboard window image or display values (text only) to a user-selected program or application, or saves it as a file.
Timer...
Opens a dialog with a timer that can be set for the dashboard to automatically refresh at a defined time interval. The setting is active only as long as the dashboard is open for that particular session. See other Methods for refreshing a Dashboard
Opens a Data Table window for the
selected dashboard control or for the selected cell of a Dashboard
Grid control.
 For
information on the number of decimal places displayed on a Data Table
that was generated from a Dashboard Grid, see Rows
defined by.
For
information on the number of decimal places displayed on a Data Table
that was generated from a Dashboard Grid, see Rows
defined by.
The right-click menu for the Big Data SPC control always displays the following options for viewing selected data on a data table or on a chart. This is true even when only one of the two grids - Discrete data or Continuous data - is displayed.
View Data
Chart
View Continuous Data
Chart Continuous Data
View Failure Data...
Opens a Data Table of real-time
failure data for the selected cell of Dashboard Grid control.
For
information on the number of decimal places displayed on a Data Table
that was generated from a Dashboard Grid, see Rows
defined by.
Lock column widths / Unlock column widths
To unlock the column widths, select Unlock column widths from the right-click menu. You must have certain rights to Locked Items in the GainSeeker System Administration module to lock or unlock column widths.
You can change a data record or note for a dashboard control using View data on the right-click menu of most dashboard controls. The dashboard display will update to include and save the change.
To change a data record:
Right-click a control for which you want to change a data record or note.
Click View data... on the menu that displays.
A Data Table grid of the data opens on the GainSeeker Charts window.
Right-click a row in the table you want to change. Then, click
Edit data... or Edit
note... on the list that displays.
For more information, see Editing
an SPC data record, Editing
Defect Data and Traceability or Editing
Defect Note and Corrective Action