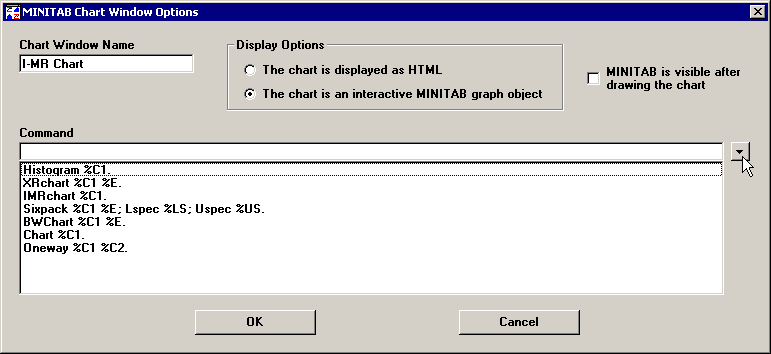
In the Command box, you must specify which MINITAB commands will be executed to generate this chart. There are two ways to enter a command string:
Click the arrow to select a command from the list.

After selecting one of the commands from the list, you may edit the command as needed to customize this chart. This will not affect the commands on the drop-down list.
If desired, you can add more commands to this list. For more information, see Edit command list.
Simply type the MINITAB command string you want to use.
If you want to use additional MINITAB commands but you are not sure of the syntax, you can use MINITAB to determine which commands to use for new charts:
Send some GainSeeker data to MINITAB.
In MINITAB, generate the new charts you desire from the GainSeeker data.
In MINITAB, go to the Project Manager and click the History folder. This folder displays the MINITAB commands used to generate those charts.
When copying new commands from the MINITAB History folder and pasting them into GainSeeker, you should replace the following portions of the MINITAB command with these GainSeeker placeholders:
|
portion of command: |
use these placeholders instead: |
|
column names (defined by Column 1 and Column 2) |
%C1 and %C2 If you need to use additional table columns (%C3, %C4, etc.) for your MINITAB command, you can choose additional columns to send. |
|
upper specification limit |
%US |
|
lower specification limit |
%LS |
|
subgroup size |
%E |
|
other constants and statistical values |
%SOn where n is one of the Statistics identification code numbers Example: To reference the Target X from the standard, which is SPC statistic number 252, use the placeholder %SO252. |
For example, if you copy the command string
CuSum 'Data' 'Row'; Target 0.5.
from MINITAB to GainSeeker, you should replace the following portions of this command:
|
portion of command: |
use these placeholders instead: |
|
'Data' |
This value specifies which column contains data values. If you define Column 1 (%C1) as Data, then you should specify %C1 for this value. |
|
'Row' |
This value specifies which column contains subgroup size information. If you define Column 2 (%C2) as Row, then you should specify %C2 for this value. |
|
0.5 |
This number represents the Target X for this measurement. The SPC statistic number for Target X is 252, you should specify %SO252 for this value. |
The resulting command string for GainSeeker to use when creating this MINITAB chart is
CuSum %C1 %C2; Target %SO252.