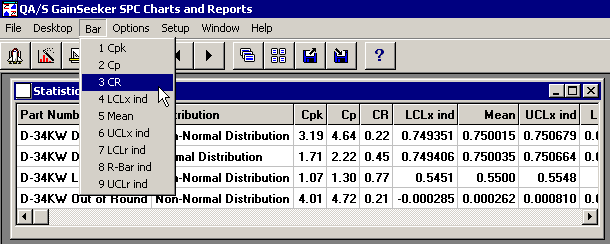
This table reports statistics for multiple retrieval groups.

You can customize the Statistics Table to report any of several hundred statistics. For more information, see Creating a Statistics List or Statistics Table format.
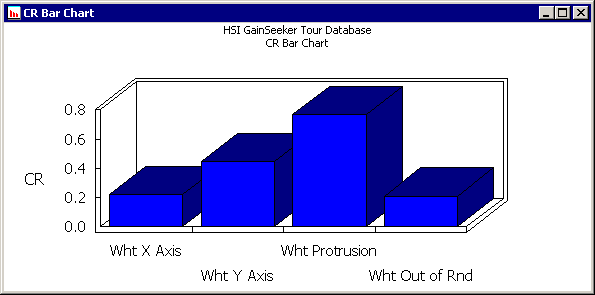
You can also display a Bar chart of any statistic shown on the Statistics Table. Make sure that the Statistics Table is the active (highlighted) chart, then click the Bar menu and select the statistic for which to create the chart.


The statistics table can be sorted by any column. This allows you to draw a bar chart in order from low to high. To sort the table, simply click on the column title. Click again to change the sort order from ascending to descending.
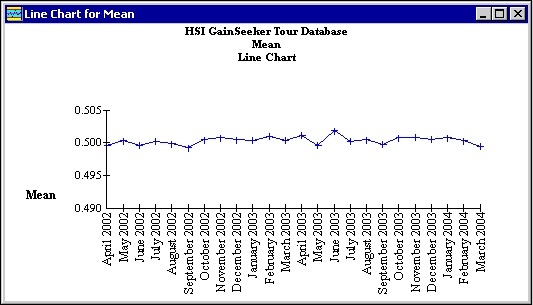
After generating a statistics table with rows in chronological order – for example, by using Chart Designer to create a report based on multiple date ranges – it is possible to draw a line chart of the consecutive values of one statistic from your table. For information, see Line chart for Statistics Table.
