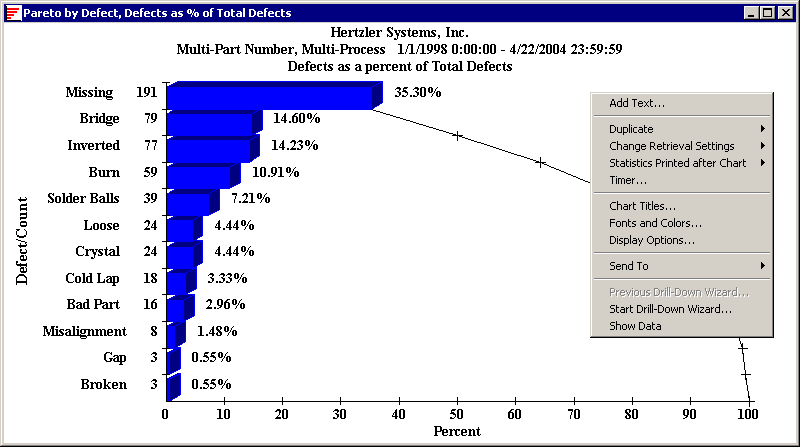
If you want to analyze the most likely items to drill-down into for deeper analysis, select Start Drill-Down Wizard from the Options menu or right-click menu on a Pareto, Pie, or Bar chart.

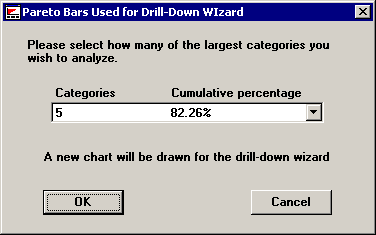
The first question you are asked is how many of the original categories you want to include in your analysis. Both the number of categories and the cumulative percentage are shown to help you with this choice. The selected item represents the first category where the cumulative percentage totals 80% or more.
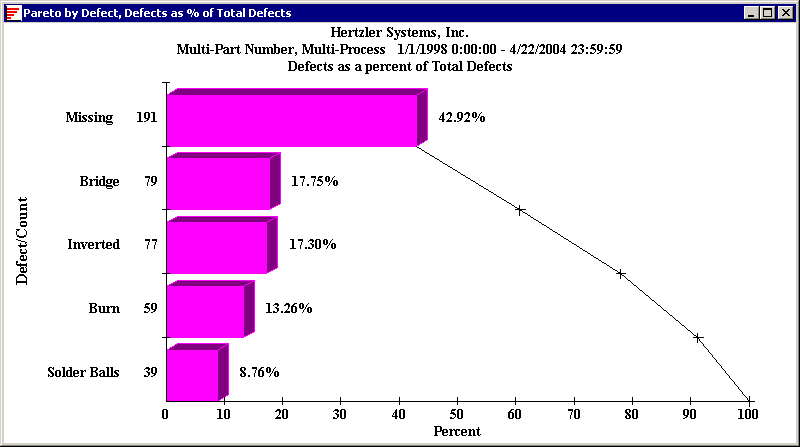
After clicking the OK button, a new chart is drawn which includes only the selected categories and the Drill-Down Wizard is shown immediately.
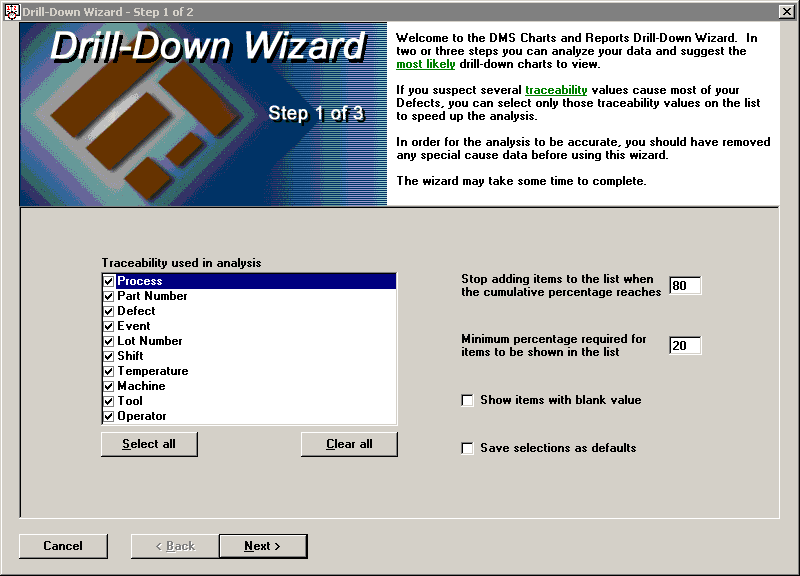
The first step of the Drill-Down Wizard allows you to pick the traceability values used for the analysis, the maximum cumulative percentage and minimum percentage for items to be shown on the list, and whether or not you want to have blank traceability values show up on the list. When you have set all of your selections, click the ‘Next’ button.
Reducing the number of traceability values will speed up the analysis. Making the maximum cumulative percentage lower or the minimum percentage higher will reduce the number of items displayed on the next step.
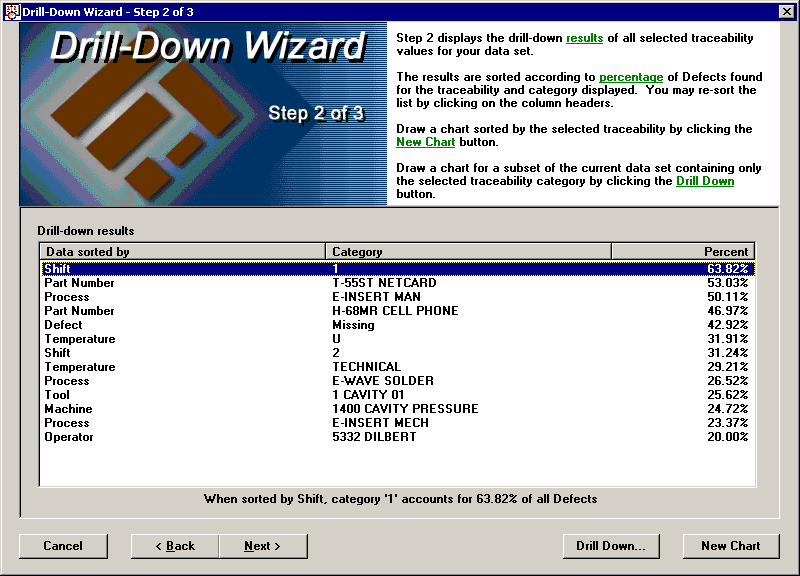
The second step of the Drill-Down Wizard shows the analysis results of all traceability values selected on step one. The results are sorted according to percentage of defects found for the traceability and category listed. You may want to check the descriptive comment below the list that explains each item as it is selected.
You will usually want to select items at the top of the list for further analysis. In some cases, the results may be expected and can be ignored, such as when 50% of the results are from Shift 1 and 50% are from Shift 2.
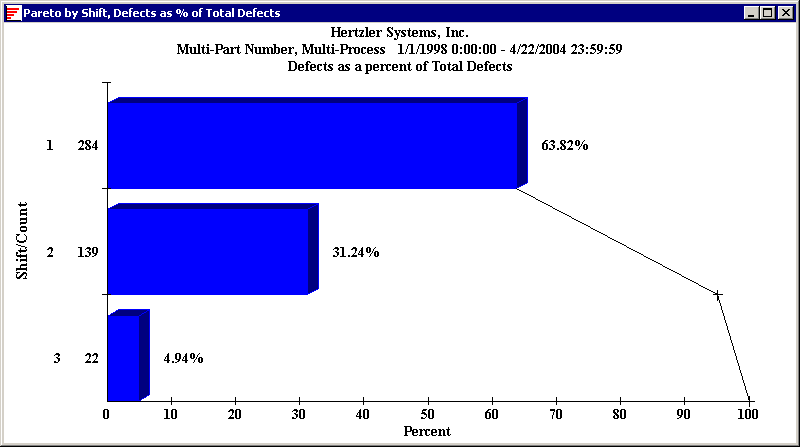
If you click the New Chart button, you will get a new chart that looks at all categories for the selected traceability. The following example shows all three shifts even though only two appear on the list (the percentage of defects from Shift 3, 4.94%, falls below the minimum required, 20% in this example, to show it in the list).
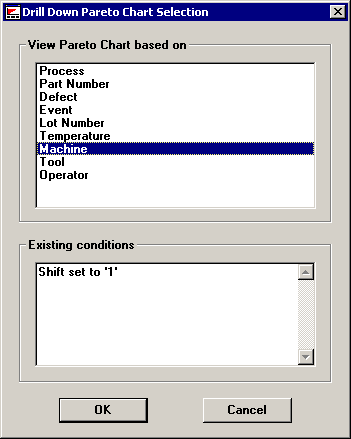
If you click the Drill Down button, you will get the following dialog to choose the drill-down category. (This dialog should look familiar if you have drilled-down on Pareto charts before using the Drill-Down menu.)
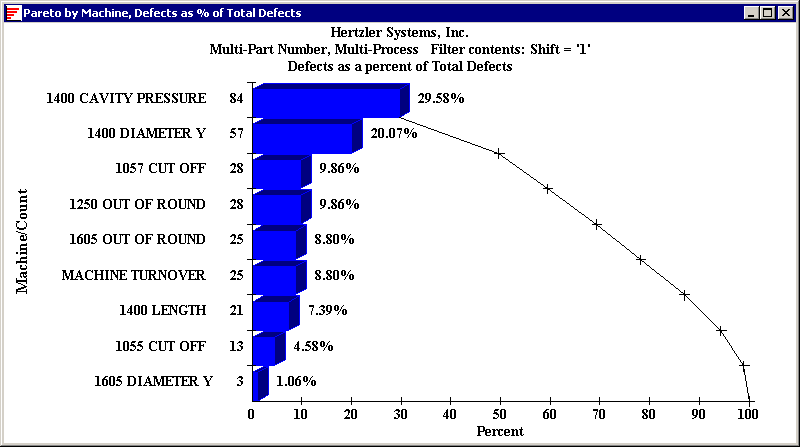
If you would choose to drill-down into Shift 1 by Machine, you would get the following chart:
If you click the ‘Next’ button on step 2, you get a list of the highest percentages of the drill-down choices for the selected traceability value displayed on step 3.
As you can see, analyzing Shift 1 by Machine was not the best choice for this data set. Machine appears as the seventh item on the list, and much better choices would be Process or Part Number.
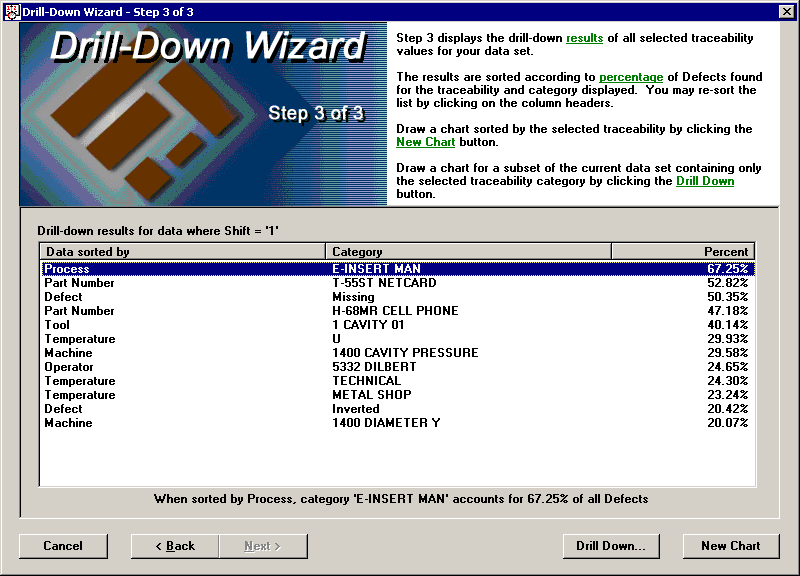
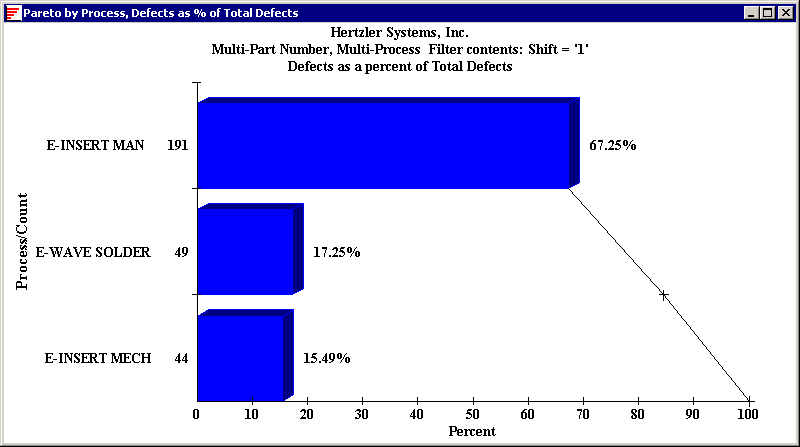
If you click the New Chart button, you will get a chart for the selected traceability value from step 2 (Shift = ‘1’) sorted by the selected traceability from step 3 (Process).
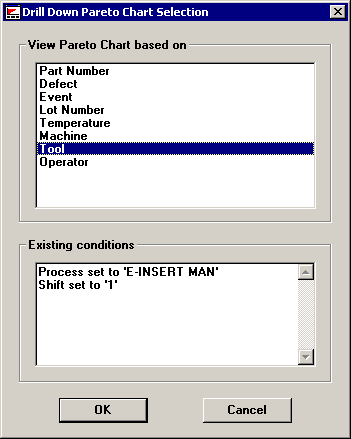
If you click the Drill Down button, you will get the drill-down dialog with the traceability value from both steps 2 and 3 selected. This time Tool is selected instead of Machine based on the results of step 3.
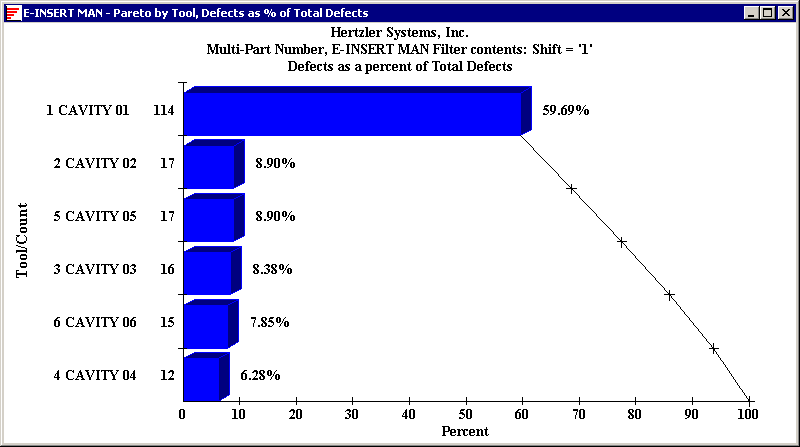
The following chart suggests that ‘1 Cavity 01’ might be contributing an excessive number of defects for ‘E-INSERT MAN’ on Shift 1.
For more help on drilling down on data, see Drilling Down to the root cause in a Pareto Chart.