Any time you have a Pareto, bar or pie chart displayed, you can drill down into one of the bars to look at the data behind that bar. You can continue drilling down for up to 10 layers of data to uncover the root cause of the defect.
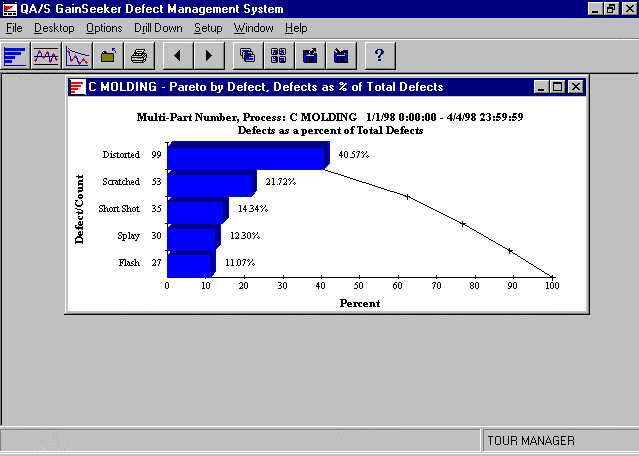
The basic Pareto chart tells you what your biggest problem is. In the Defect Management System, you can assemble Pareto charts by process, parts, defects, events and traceability criteria.
A few seconds after your cursor stops over any bar of the chart, a pop-up message will remind you that you can drill down by left double clicking or right clicking on a bar.
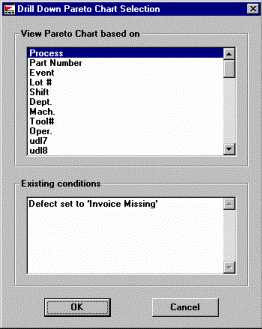
To see what shift, operator or machine was responsible for any particular defect, double-click on that bar with the left mouse button. The Drill Down dialog appears. It gives you a choice of options for the next level of data to chart. You may choose any of the options for your next drill down.
The Existing conditions section at the bottom of the dialog lists options you have already charted.
You may also drill down by clicking on the right mouse button and selecting Drill Down.
This example of drilling down assumes you started at one process, multi-part numbers.

The original Pareto bar will be blue. When the first drill down appears, the blue color of the bar used for the drill down changes to the color of the second level—pink.
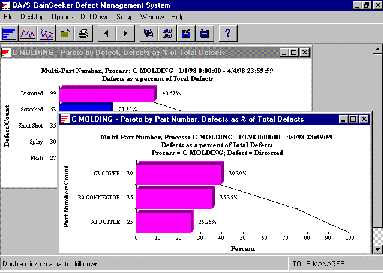
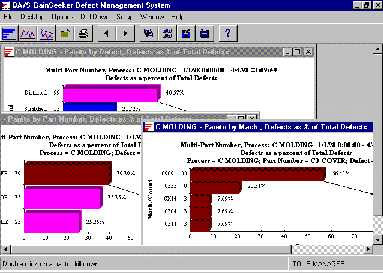
The second drill down (below) is by machine.
The Existing conditions section of the Drill Down dialog continues to track the activities or categories you have charted. The dialog below represents the report after the second drill down.
Notice that the list of your available options decreases with each drill down.
The third drill down is by shift.
The colors of the Pareto bars can help you remember on which bar you were drilling down and the order of the drill down. Once you drill down on a bar, it changes to the color of the next level of data.
For example, in the sequence below, the original bar was blue. The first drill down was done on the top bar, which changed to purple--the color of the first level of data below the original bar. The third level of data is dark red and the top bar of the second drill-down bar turned to brown. The fourth level of drill down is green, and the third level drill-down bar turned to green.
In this example, the original blue Pareto chart is in the bottom right. The first drill down (Part Number) is pink and in the top right. The second drill down (Machine.) is dark red and in the bottom left. The third drill down (Shift) is light green and in the upper left.
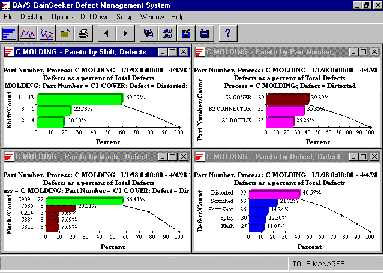
Normally charts cascade over one another with only their title bars visible. They are tiled here for illustration purposes.
|
Level |
Color |
Example |
|
1 |
Blue |
|
|
2 |
Magenta |
|
|
3 |
Dark red |
|
|
4 |
Light green |
|
|
5 |
Violet |
|
|
6 |
Cyan |
|
|
7 |
Dark green |
|
|
8 |
Grey |
|
|
9 |
Red |
|
Side-by-side comparisons of charts can be very useful in analyzing your drill downs. To see more than one graph on the screen:
From Window menu, select Tile Horizontal or Tile Vertical.
–or–
Click on the Tile button on the toolbar.
There are two ways to change the chart type on a chart generated by drilling down:
Right-click on the drill-down chart.
Point to Chart Type.
Select Pareto, Pie or Bar.
Alternately, with the drill-down chart as the active chart:
Click the Options menu.
Point to Chart Type.
Select Pareto, Pie or Bar.
To view the underlying data for a chart that was generated by drilling down, click the Options menu or right-click on the drill-down chart, and then click Show Drill-down data.
This displays all data records with defects that make up the drill-down chart. To view the contents of one defect data record or its note, right-click that row of the data table and then click View Data or View Note. You cannot edit or delete data or notes from a drill-down data table. For instructions on editing or deleting data or notes, see Editing defect data and notes.
Options for changing the data table display include the following:
To change the columns displayed on the data table, right-click the drill-down data table and then click Select Display Columns. For more information, see Selecting Display Columns.
To change the fonts and colors used to display the data table, right-click the drill-down data table and then click Fonts and Colors. For more information, see Changing Fonts and Colors on Tables and Lists.
To hide individual defect counts, right-click the drill-down data table and then click Collapse Table.
To display the individual defect counts again, right-click the drill-down data table and then click Expand Table.
To send the contents of the data table to the clipboard, to an e-mail, or to another application, right-click the drill-down data table, point to Send to, and then click the desired option. For more information about Send to options, see Send To options from the Right-click menu.
You can also search for values in the drill-down data table. For instructions, see Searching for values in a table of data.
To return to the drill-down chart and other functions in the DMS Charts and Reports module, click Close.
For more help on drilling down to a root cause, see Using the Drill Down Wizard.