![]() Note: To avoid retrieving data for every standard in your database, (and starting a search that could take several hours to execute), you should apply a data filter for specific standards.
Note: To avoid retrieving data for every standard in your database, (and starting a search that could take several hours to execute), you should apply a data filter for specific standards.
The statistical filter you choose on this tab will affect which rows are displayed on the dashboard. This tab will also affect the colors used to display these rows.
Choosing a statistical filter
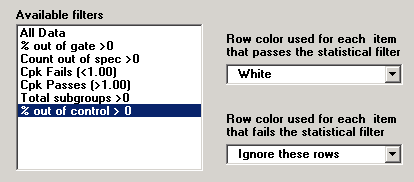
Select a statistical filter from the Available filters list.
If you choose All Data for your statistical filter, the color settings (explained below) will be ignored.
|
|
Choosing color and display options
The statistical filter dashboard will always display the rows that meet the criteria in the statistical filter. You can choose whether to display rows that did not meet the statistical filter criteria, as well as the colors for each type of row.
There are two basic ways to set these options:
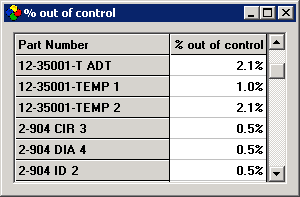
Display only the items that pass the statistical filter

By default, the Row color used for each item that fails the statistical filter is set to Ignore these rows. Using this setting, the resulting dashboard will look something like this:

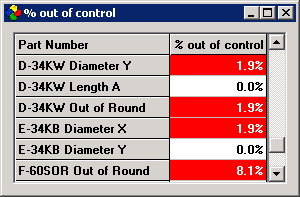
Show items that pass and items that fail the statistical filter
If you choose a color for Row color used for each item that fails the statistical filter, the resulting dashboard will look something like this:
