The SPC Chart Options window lets you configure charts to display on the current sub-inspection. For information on opening this window, see Setting charts to display in inspections.
|
Contents [Hide] |
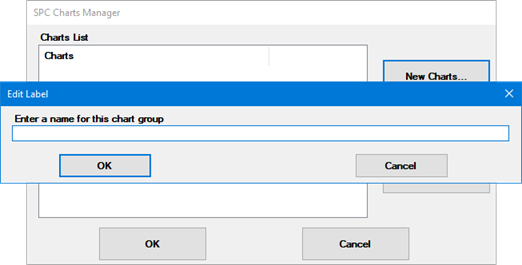
When you first click New to create a group of one or more charts, you are prompted to name that group.

When editing the chart group, you can change this name.
If you want this sub-inspection to chart multiple standards with the same chart types and chart settings, you can use this step to select all those standards at once – beginning with the Part Number Source:
Select standard from list:
This creates static charts for any standard you choose – regardless of any Numeric Input tests in the inspection. These charts will not be updated when new data is entered on this inspection, unless the inspector right-clicks the chart to refresh or it is refreshed by a Python script.
For help selecting standards, see Selecting Part Numbers or Processes.
This creates dynamic charts that are linked to the Numeric Input test(s) you select. These charts will be automatically updated when new data is entered on this inspection. Any of these charts will also be automatically updated if the standard, filter name, or filter contents change, and it will be removed (single-retrieval charts from the left-hand list) or updated (multiple-retrieval charts from the right-hand list) if the linked Numeric Input test is hidden. For more details, see Chart behavior during data entry.
If you use this option, you can also use the Apply Filter from numeric input check box to apply any filter that is specified in each Numeric Input's Filter property.
When this check box is selected, the option to choose a filter on Step 3 is not available.
When this check box is selected, and you use Step 2 to select any multiple-retrieval charts from the right-hand list, those charts will be filtered only if all the Numeric Input tests specify the same filter and filter contents.
Note: If you copy and paste a sub-inspection that is configured with one or more charts that Use numeric input standard, you will need to re-select the standards for these charts in the new copy of the sub-inspection. This is because the numeric input tests in the new sub-inspection will have different TestIDs from those in the original sub-inspection. A reminder message will be displayed when you copy and paste such a sub-inspection.
When finished selecting standards, click Next Step.
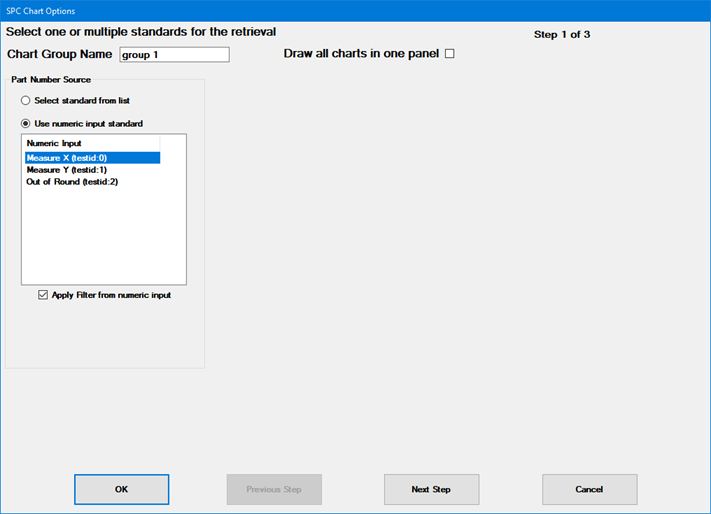
For this chart group, the Draw all charts in one panel check box sets whether to display each chart on a separate side panel tab or combine all of the charts on one side panel tab.
Clearing the Draw all charts in one panel check box displays each chart on its own tab, like this:
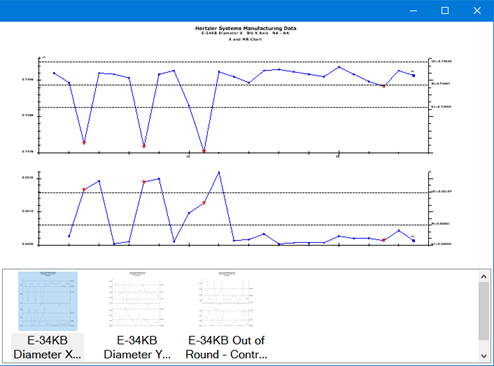
If two chart groups with this setting draw the same chart type for the same information (SPC standard, Filter, and Date Period), only one side panel tab will be created.
Selecting the Draw all charts in one panel check box combines all of the charts on one tab, like this:
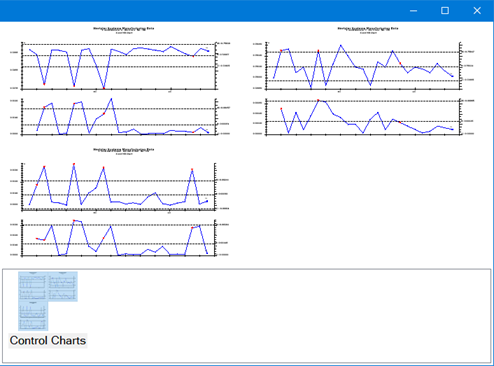
When combining multiple charts on one tab:
Displaying more than 16 charts on one tab is not recommended; it can greatly slow down performance when refreshing the charts or resizing the side panel.
The tab name is set to the chart group name.
If the chart fonts are too small, choose a chart skin with larger font sizes on Step 3.
A chart group with this setting always creates a side panel tab - even when another chart group draws the same chart type for the same information (SPC standard, Filter, and Date Period).
When a group is charting multiple numeric input standards that are set dynamically (by the inspector or by a Python script) to the same standard name, the charts for each standard will be added to the group's side panel tab even if they are duplicates of another standard's charts.
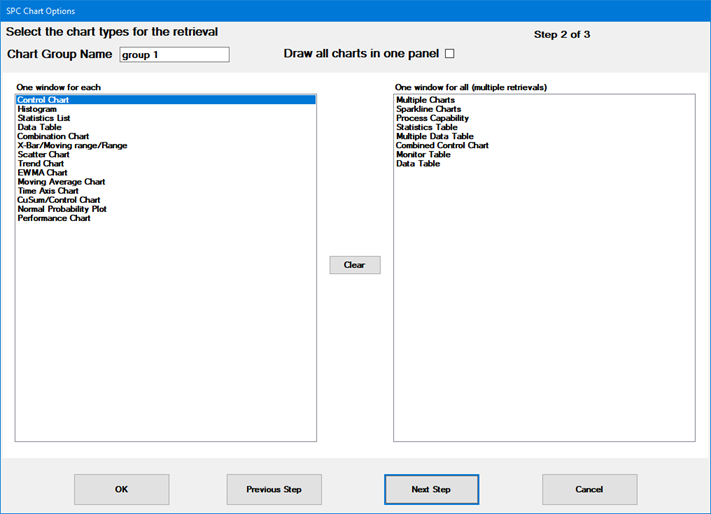
Select the SPC chart types you want to display, and then click Next Step.
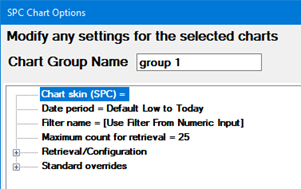
Choose retrieval and statistical settings for the standards and charts you have selected. You can also specify a Chart skin (created in the GainSeeker Charts module) that changes display options for these charts. When finished, click Save and Close.
If you want the charts to display the same data that is retrieved to calculate statistics (such as Control limits, Mean, R-bar, 2SD, and 3SD) for real-time failure checks, you should make sure the charts use the same Filter as the Numeric Input tests and use the default settings for Date period and Maximum count for retrieval. (The Default date period for SPC Data Entry and the default Maximum count for retrieval are both set in the System Administration module.)
 Note: If you display a Statistics
List or Statistics Table, GainSeeker will use the default report name
from the current Chart skin (if specified) or from the current GainSeeker
configuration. If a default Statistics list or Statistics table report
name is not specified in either of these areas, GainSeeker will simply
display system default statistics on these charts.
 Tip: If desired, you can configure
the charts with a special filter for data that matches traceability values
in this inspection, as described below:
In some cases, you may wish to filter the chart for a traceability value that was entered in this inspection – by a Traceability test in a previous sub-inspection or the current sub-inspection, a Planned Inspection, or a Formula test. If this chart group is linked to a Numeric Input test, any single-retrieval charts from the left-hand list can also filter for the TestSpecificTrace property on that test. (Multiple-retrieval charts from the right-hand list are not affected by TestSpecificTrace.)
For example, you might wish to filter for:
a Lot number that the user enters during data entry
a Machine ID that you preset with a Planned Inspection or Formula test
To filter for such a traceability value – which may vary from one data entry session to the next – you must create a Quick filter or a saved filter that looks for a blank value in that traceability field, such as this example which filters for the current Cavity number:
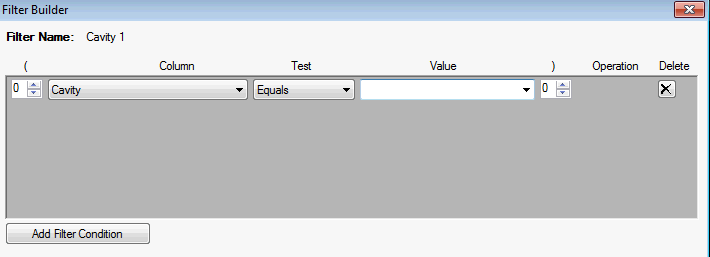
If this traceability value is not set before the sub-inspection with the filter is opened, the charts that use this filter will not be drawn until a value has been set for this traceability field. If this traceability value is cleared, the charts that use this filter will be removed.
A chart will open when the sub-inspection opens and all information necessary to open the chart (SPC standard, Filter name, and Filter contents) has been defined.
Any chart linked to Numeric Input tests will be refreshed (the chart's data is re-retrieved from the database and statistics are recalculated) when there is a change to any of the information for the chart (SPC standard, Filter name, and/or Filter contents). Changing any traceability values that will be stored with the linked tests will also cause the charts to refresh. These changes can be triggered by the sub-inspection that created the chart or by a later sub-inspection that changes any of these values.
Submitting data for any linked chart will refresh that chart, unless that chart is linked to a Numeric Input test whose SPCStandardSelection property is set to DoNotStore.
Side panel charts will be closed when any of the information for the chart is removed, when a linked Numeric Input test is hidden (if chart is drawn only for that test), when the side panel is cleared, or when the inspection is closed.
The inspector can interact with the chart by clicking or right-clicking on the chart's background or graphics.