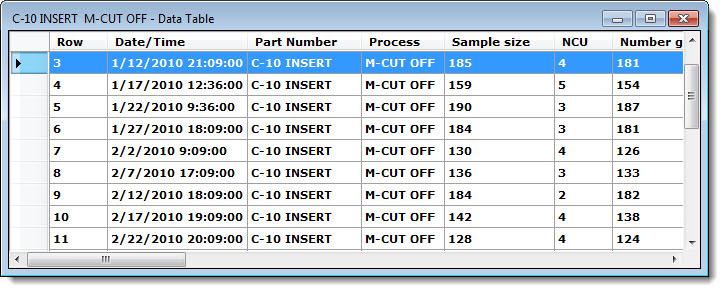
A Data Table is a comprehensive display of data and traceability values you select that display in a table format.
You change add or change columns in a Data Table or display a Statistics List underneath it. See Navigating to the Data Table options in this topic.

|
Contents [Hide] |
Use the Data Table columns setting to add or change the columns in a Data Table.
Use the Statistics under data table setting to select a statistics list to display under a Data Table.
You can navigate to either setting using the Settings tab or the right-click menu for a Data Table.
Navigate to either setting following this path on the Settings tab:
Chart overrides | Charts | Default reports |
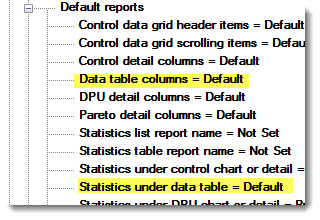
Then, double-click Data table columns = to add or change columns. The Data table columns dialog opens. See Using the Data table columns dialog
-or-
Double-click Statistics under data table to change a statistics
list under a Data Table. The
Statistics under data table
dialog opens. See Using
the Statistics under data table dialog.
 Note:
For a statistics list to display under a Data
Table, the checkbox preceding the Show
statistics list option must be selected. Navigate to this setting
by following this path on the Settings
tab: Chart overrides | Charts | Show
statistics list
Right-click on an existing Data Table to open the right-click menu options for a Data Table.
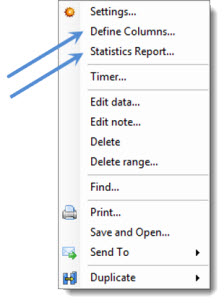
-or-
Click Statistics Report... to add or change a statistics list under a Data Table. See Using the Statistics under data table dialog.
 Note: For a statistics
list to display under a Data Table,
the checkbox preceding the Show statistics
list option must be selected. Navigate to this setting by following
this path on the Settings tab:
Chart overrides | Charts | Show statistics
list
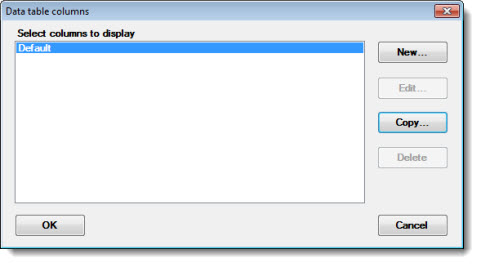
To edit, copy, add, or delete a data table report of columns to display:
Click New... To create a new report.
-or-
Click Copy... to copy the GainSeeker Default report to change the items to fit your needs.
The Enter value dialog opens.
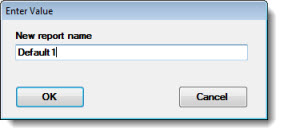
Enter a new name for the column report in the New report name text box. Then, click OK.
The Data table column - [report name] dialog opens.
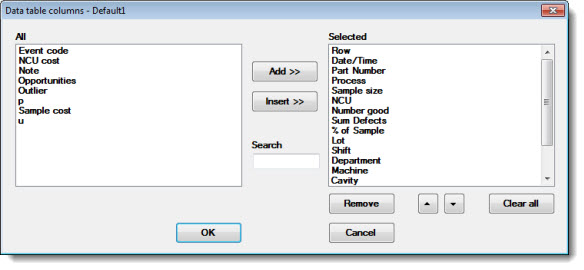
Any labels that may have been included in a report are displayed in the Selected list. Any labels that can be added to the report are displayed in the All list. See Using the buttons and features for tips on using this dialog box.
The Data table columns dialog displays with the new report name highlighted.
Click OK.
Click a label to select it in either list. The selected label will highlight.
To select multiple labels:
—Hold the CTRL ("control") key while clicking individual labels within a list. The selected labels will highlight.
Use the Add >> button to move selected label in the All list to the bottom of the Selected list.
Enter any part of a label name in the Search text field to display closer matches to that label in the All list.
Use the Insert >> button to insert selected labels from the All list to the position immediately above a highlighted label in the Selected list.
Use the up and down arrow buttons ![]() to reposition
highlighted labels within the Selected
list. The grid will display the Selected
labels in the same order as they are displayed in the Selected
list.
to reposition
highlighted labels within the Selected
list. The grid will display the Selected
labels in the same order as they are displayed in the Selected
list.
Use the Remove button to deselect labels from the Selected list. The All list will redisplay those statistics.
Use the Clear all button to clear the labels from the Selected list. The All list will redisplay all of the available labels.
See duplicating data for information on converting a Data Table into a chart.