Sending Charts to Power BI
When a GainSeeker chart is open, you can easily send its data to My workspace in the Microsoft Power
BI service for customized analysis. This functionality is not available
for Dashboards.
Before you begin
Before you can send charts to Power BI, your IT staff must set up a
GainSeeker application in Azure Active
Directory.
When finished, they should provide you with the following information:
Also, Power BI limits how many columns
GainSeeker can include in the resulting dataset. You should evaluate your
GainSeeker data to make sure that the columns you need will be included
in the dataset.
Set up your Power BI Account details
Perform this step once per GainSeeker workstation. If desired, you can
configure GainSeeker for multiple Power BI Accounts.
Create any GainSeeker
chart: choose SPC or DMS/OEE data, for one or more standards or
processes, and any chart type - graphical charts, lists, tables, etc.
Right-click on that chart (or click the File
menu), point to Send to, and
then click Power BI. (You
must have permission for Send
To >> Printer Or Editor to see this menu option.)
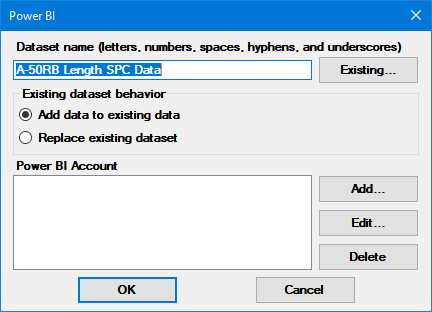
This displays the Power BI
window:

In the Power BI Account
area, click Add.
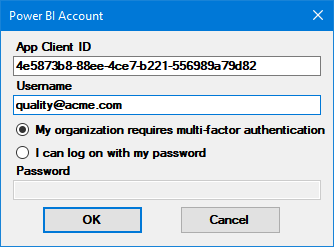
On the Power BI Account
window:

Enter the App Client ID
provided by your administrator.
For the Username,
enter your network login (email address). This must be the same
address you use to log in to Power BI.
Choose the sign-in method (multi-factor authentication or
log in with password / single sign-on) provided by your administrator.
If you choose multi-factor authentication, you will be prompted
for your Microsoft login credentials once per GainSeeker Charts
session (unless your computer is already logged in to the Power
BI service).
If you choose log in with password, enter your Power BI Password
here as well. GainSeeker will remember this password (encrypted)
for sending data to Power BI and not prompt you for it again.
If you don’t know which to use, try the password option first.
When finished, click OK.
To test your Power BI Account settings, click the Existing
button on the Power BI window.
If prompted for your Microsoft login credentials, enter
them to log in to the Power BI service.
If prompted for Permissions
requested, click Accept.
If your settings are correct, this will display a Pick from List window (even
if the list is empty).
If there are problems with your settings, this will display
an error message and you should consult with your administrator
to resolve the problem.
Sending data to Power BI
Create a GainSeeker
chart of the data you want to send (up
to 10,000 records). This works for SPC and DMS/OEE data, for one
or more standards or processes, and for all chart types - graphical
charts, lists, tables, etc.
This retrieves the data that you will send to Power BI.
Right-click on that chart (or click the File
menu), point to Send to, and
then click Power BI. (You
must have permission for Send
To >> Printer Or Editor to see this menu option.)
This displays the Power BI
window:

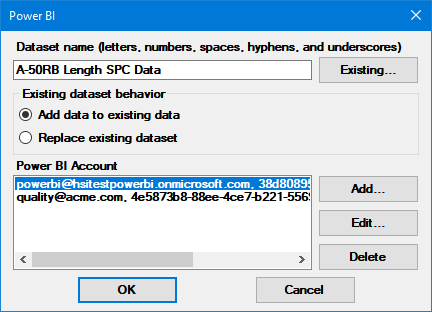
Select the Power BI Account
where you want to send the data (if you have more than one).
If the Power BI Account list
is empty, you need to set up your Power
BI Account details before continuing.
Select the Power BI Dataset
where you want to send the data.
If desired, you can use the default dataset name provided
by GainSeeker.
To select from existing datasets in your Power BI account,
click Existing.
To create a new dataset, enter a Dataset
name comprised of only letters, numbers, and three punctuation
marks - spaces, hyphens (-), and
underscores (_).
If the specified Dataset
already exists, choose whether to delete its data before adding the
new data to it.
To append new data to the dataset, select Add
data to existing data.
Power BI will not re-import any GainSeeker data row that already
exists in the dataset. (All data fields in the row must match
to be considered a duplicate, so editing data in GainSeeker and
then re-sending to Power BI will append it as new data.)
Power BI uses column names to correctly append new data to existing
data, so changing the labels on traceability fields or any other
values used as column headers may provide unexpected results.
To delete the existing dataset and recreate it with new
data, select Replace existing
data.
If you find that Power BI deletes a report when its underlying
dataset is deleted, you may need to avoid this option and use
Power BI features to manage the dataset or filter the data on
reports.
Click OK to send the
chart's data to one dataset in My
workspace on the Microsoft Power BI service. If prompted for
your Microsoft login credentials, enter them to log in to the Power
BI service.
 See below for important limitations on what data
can actually be sent.
Data limitations
Because Power BI limits how many columns and rows
GainSeeker can include in the dataset, the following restrictions are
applied.
Maximum number of columns
Because GainSeeker can only send up to 75 columns to the dataset, GainSeeker
sends the 75 most commonly-used data columns.
SPC data columns
For SPC data, these columns are:
Column |
Details |
PARTNO |
Name
of the SPC standard. |
DATETIME |
Date/time
stamp in 16-digit GainSeeker format - 4-digit year, 2-digit month,
2-digit day, 2-digit hour, 2-digit minute, 2-digit second, 2-digit
hundredths of second. |
0-48 traceability fields |
Fields
where Display
traceability label is cleared are not included.. |
DATA1 - DATA16 |
The
first 16 measurements in the subgroup.
Unused fields are left blank (for subgroup sizes < 16 and
missing data values in the subgroup).
 If you have GainSeeker standards with subgroup
sizes > 16, this means that some measurements will not
be included in the dataset. If you need to send all measurements
to the dataset, you may be able to use an external
data Python script that splits
each row into subgroups of 1 with a unique value in each new
subgroup (date/time stamp, traceability value, etc.). If you have GainSeeker standards with subgroup
sizes > 16, this means that some measurements will not
be included in the dataset. If you need to send all measurements
to the dataset, you may be able to use an external
data Python script that splits
each row into subgroups of 1 with a unique value in each new
subgroup (date/time stamp, traceability value, etc.).
|
XBar |
X-Bar
calculated from all GainSeeker measurements in the subgroup (including
subgroup values 17-72 that cannot be sent to Power BI). |
Range |
Range
calculated from all GainSeeker measurements in the subgroup (including
subgroup values 17-72 that cannot be sent to Power BI). |
MRange |
Moving
Range calculated from all GainSeeker measurements in the subgroup
(including subgroup values 17-72 that cannot be sent to Power
BI). |
Sigma |
Sigma
calculated from all GainSeeker measurements in the subgroup (including
subgroup values 17-72 that cannot be sent to Power BI). |
RTF |
Integer
that represents one or more real-time
failure codes. |
EVENT |
Long
description. |
CAUSE |
Long
description. |
ACTION TAKEN |
Long
description. |
Note |
|
DMS/OEE data columns
For DMS/OEE data, these columns are:
Column |
Details |
PARTNO |
Name
of the DMS/OEE part number. |
PROCESS |
Name
of the DMS/OEE process. |
DATETIME |
Date/time
stamp in 16-digit GainSeeker format - 4-digit year, 2-digit month,
2-digit day, 2-digit hour, 2-digit minute, 2-digit second, 2-digit
hundredths of second. |
0-40 traceability fields |
The
first 40 traceability fields that can be displayed in all GainSeeker
modules. (Fields where Display
traceability label is cleared are not included.)
If GainSeeker is configured to display 41-48
traceability fields and you need to display a field that is
not in the first 40, you can use a copy of your current configuration
to hide one of the first 40 traceability fields. Use that same
copy of the configuration to retrieve and send the data to Power
BI. |
DEFECT1 - DEFECT12 |
The
first 12 defect names (DEFECT1, etc.) and their corresponding
defect counts (DEFECTCNT1, etc.) for the row. Unused defect
columns are blank and their corresponding defect counts are 0.
GainSeeker always stores the defect name with the highest count
as DEFECT1, the second-highest count as DEFECT2, etc.
 One row of GainSeeker data can have up to
20 defect names, so if you have data rows with more than 12 defect
names, this means that the defects with the lowest counts will
not be included in the dataset. If you need to send all defects
to the dataset, you can use an external
data Python script that splits each row with more than 12
defect names into two rows of 12 or fewer defect names, with a
unique value in each row (date/time stamp, traceability value,
etc.). One row of GainSeeker data can have up to
20 defect names, so if you have data rows with more than 12 defect
names, this means that the defects with the lowest counts will
not be included in the dataset. If you need to send all defects
to the dataset, you can use an external
data Python script that splits each row with more than 12
defect names into two rows of 12 or fewer defect names, with a
unique value in each row (date/time stamp, traceability value,
etc.).
|
DEFECTCNT1 - DEFECTCNT12 |
SUMDEFECTS |
Total
number of defects (including defects 13-20 that cannot be sent
to Power BI). |
SSIZE |
Sample
size (total number of units inspected). |
SampleCost |
Total
cost of all units inspected. |
NumberGood |
Number
of good units inspected. |
NCU |
Number
of nonconforming units inspected. |
NCUCOST |
Total
cost of nonconforming units inspected. |
EVENT |
Long
description. |
Note |
|
Dashboard Controls
This option is available for the following dashboard controls: Dashboard
DataTable (both SPC and DMS), Dashboard Grid (both SPC and DMS), Big Data
(both SPC and DMS), Paired Sample Grid, and Defect Trend Wizard. For the
Dashboard Grid, if multiple columns have the same name the column number
will be appended to the name to make it unique.
Maximum number of rows
Because GainSeeker can only send up to 10,000 rows at a time, you can
use the following steps to include more data in the dataset:
Use a date period, filter,
or chart
generation for a data group to limit the initial chart to 10,000
rows or less. (If creating an SPC chart, set the Maximum
count for retrieval greater than 10,000 to ensure that data is
only limited by these other features.)
Send that data to Power BI.
On that initial chart, change
the chart settings for date period or filter - or generate a new
chart for the next data group - to limit the next group of data to
10,000 rows or less.
Send that data to Power BI using the same Dataset
name and choosing Add data
to existing data.
Repeat steps 3 and 4 until all of the desired data has
been added to the dataset.


 See below for important limitations on what data
can actually be sent.