Some information in this topic may be specific to the GainSeeker Charts module.
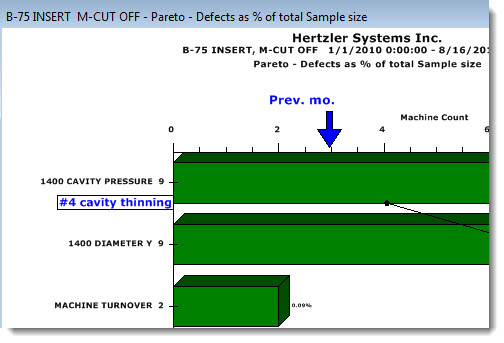
You can add text to a chart before saving, sending, or printing it. The blue text on this example is user-added text along with an added arrow (see adding arrows to charts for more information):

|
Contents [Hide] |
 Added text and arrows only remain on the chart until the chart is refreshed. For more information, see Refreshing Charts with Text or Arrows
The Add text... option is available on the right-click menus for all line charts and bar charts.
Expand or shrink the chart window to the size you want to send, save, or print. (To resize the chart window, click a corner of it and drag it larger or smaller.)
Position your cursor on the chart where you want to add text.
Right-click on the chart and choose Add Text... from the right-click menu that displays.
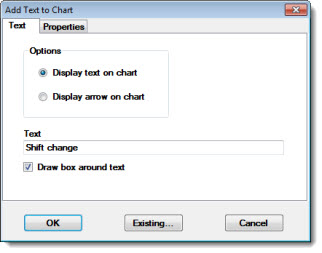
The Add Text to Chart dialog box opens with the Text tab displayed.

Click the Display text on chart option button if it is not already selected. Then, select the Draw box around text to add an optional border around your text segment, similar to this: ![]() .
.
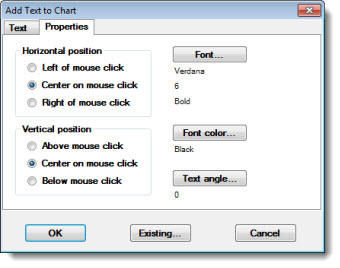
Click the Properties tab to specify details about how the text will display on the chart.

To specify where the text should appear on the chart relative to your cursor (mouse click), click an option button in the Horizontal position and Vertical position categories.
To change the color of the text, click ![]() and select a color from the Color dialog box that opens.
and select a color from the Color dialog box that opens.
To change the font type or size, click ![]() to select a new font type or size from the Font dialog box that opens.
to select a new font type or size from the Font dialog box that opens.
To change the degree of angle at which the text will display on the chart, click ![]() to select a degree of angle on the Enter value dialog box that opens.
to select a degree of angle on the Enter value dialog box that opens.
Click OK to apply your selections to the chart.
To move added text or an added arrow on the chart:
Click the item and drag it to a new location. You can repeat this action more than once.