Use the GainSeeker Drill-Down Wizard to discover the most likely items on which to drill into on a Pareto chart to discover the root causes of variation in your processes.

|
Contents [Hide] |
To ensure accuracy, remove any known special cause data before using the Drill-Down Wizard.
There are three ways to open the Drill-Down Wizard from a Pareto chart:
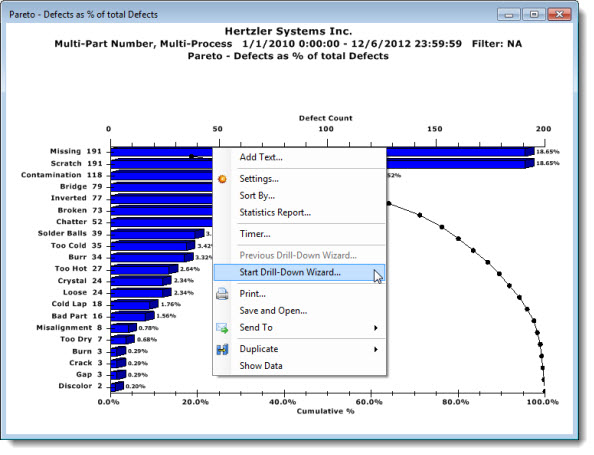
Right-click the Pareto chart , and then click Start Drill-Down wizard... on the menu that displays.
Click Options on the GainSeeker Charts window menu. Then click Start Drill-Down Wizard... on the menu that displays.
Click the Wizard button on the GainSeeker Charts toolbar.
 Tip: If you already know into which Pareto charts bars you want to drill, you can right-click a Pareto chart bar, and then select Drill Down... on the right-click menu that displays. For more information, see Drill down to the root cause on a Pareto chart bar
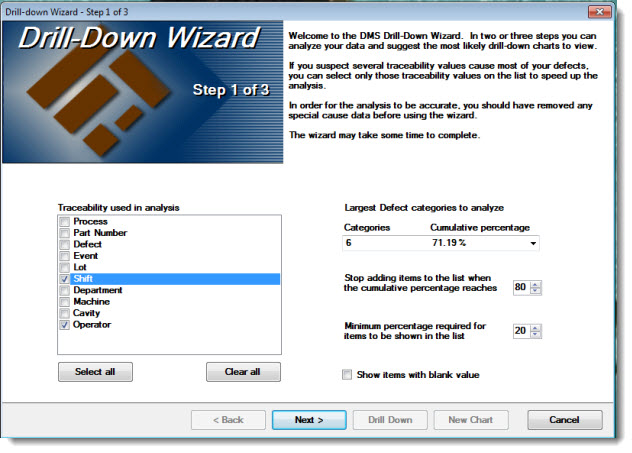
On Step 1, you can select the traceability values used for the analysis and the maximum cumulative and minimum percentages for traceability items that will display on the list.
 Tip: You can press the F1 key any time you are using the Drill-Down Wizard to open this help topic for reference.
Select the traceability values in the Traceability used in analysis list that you suspect may be the cause for most of the defects. Click an item to select or clear the checkbox preceding it. Only selected items will be included in the analysis. The lower the number of traceability items you select, the less time it will take to perform the analysis.
In the Largest Defect categories to analyze field, select which of the original defect categories you want to include in the analysis. The current number of Categories and the Cumulative percentage display to help you with this. The selected item represents the first category in which the cumulative percentage totals at least 80 %.
Decreasing the maximum cumulative percentage and increasing the minimum percentage will reduce the number of items that display in the traceability list in Step 2. After making all selections, click Next > to proceed to Step 2.

Step 2 of the Drill-Down Wizard displays the analysis for each of the traceability values you selected in Step 1.
The results are sorted by the highest percentage of defects for each traceability and category. You will usually want to select items with the highest percentage for further analysis. In some cases, the results may be expected, so they can be ignored. An example of this would be when 50% of the results are from Shift 1 and 50% from Shift 2 when you are analyzing only two shifts.
You can click a row in the Drill-down results list to view the explanation for it near the bottom of the wizard.

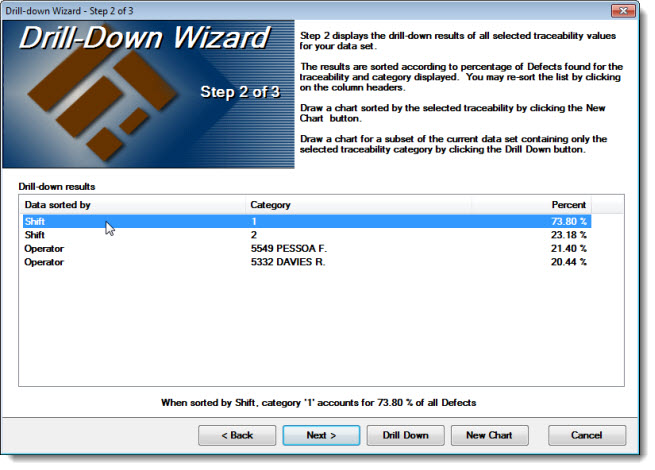
Next, you can opt to click Next, Drill down, or New Chart.
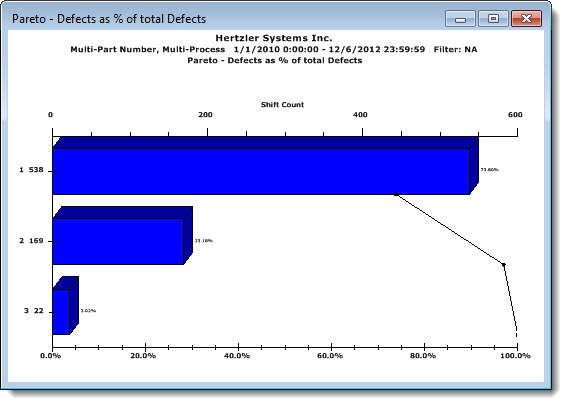
Click New Chart. A new chart displays using all of the categories for the selected traceability (in this example, Shift is selected.
The following example shows all three shifts even though only two appear on the list. In this example, Shift 3 at 3.02% falls far below the stated minimum 20% required for consideration.
Click Drill Down. The Drill Down Pareto Chart Selection dialog opens.
This offers options for drilling down through successive levels of data. Click a traceability label in the View Pareto chart based on list. (The list only includes items for which there is data pertaining to your chart.)
The Existing conditions list displays options that you have already selected.
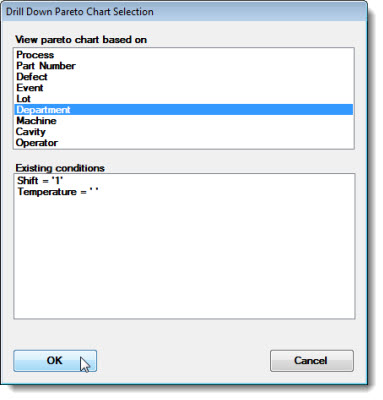
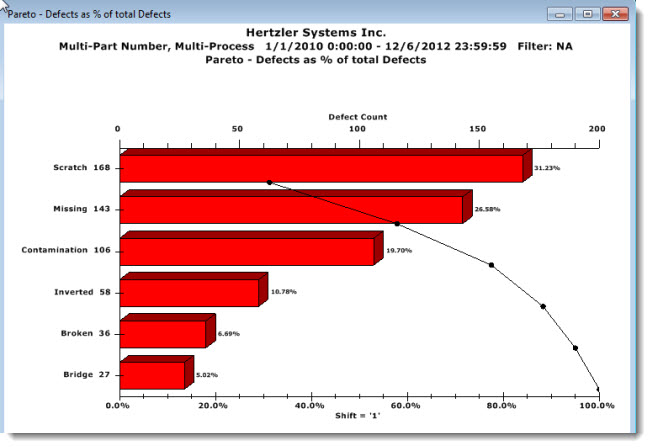
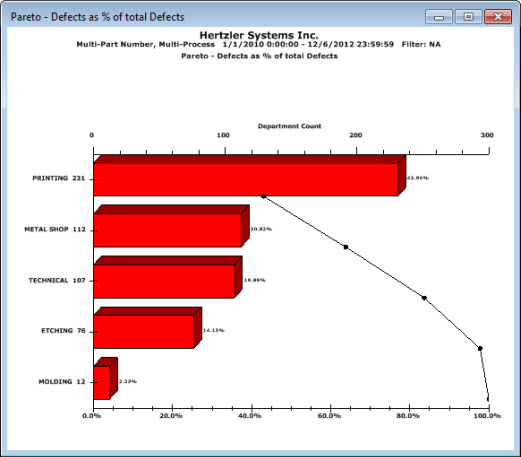
If you opt to drill-down into the listed Existing conditions (Shift 1 in this example) by Department, the following chart would display, which shows most of the defects in Shift 1 occurring in the Printing department.
Note that the Pareto bars for this new chart are red in this example whereas on the previous chart they were blue. The change in bar color for each new chart can help you to identify your current level in the drill-down analysis. See Colors that identify drill-down levels
Click Next on Step 2.
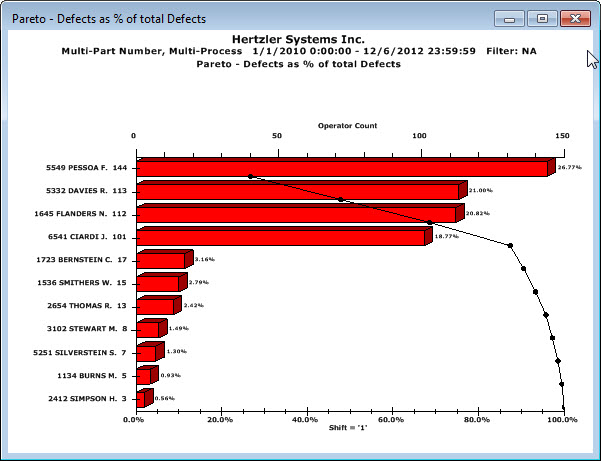
In this example, the percentages for Operator list on Step 3. Operator 5549 Pessoa F. has 26.77% of all the defects in Shift 1.
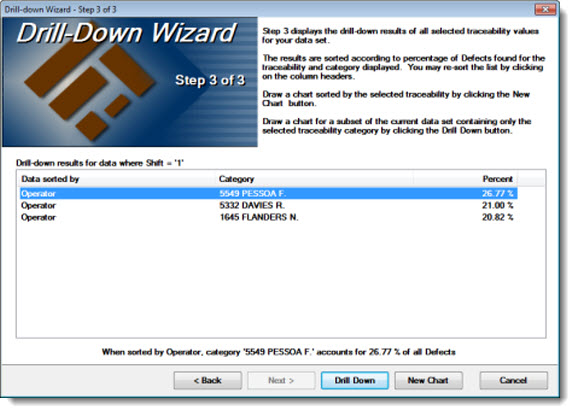
Step 3 displays the drill-down results of all the selected traceability values for your data. These are sorted according to the percentage of defects that were found for the traceability and the category displayed.
