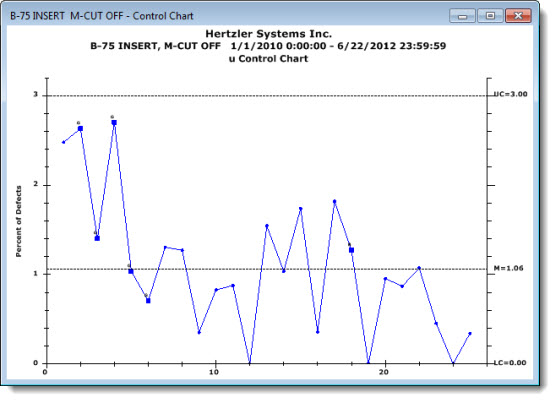
Control Charts and Control Detail tables helps to determine if defects are within the set control limits. Defect data is plotted over time. Following is an example of a u control chart:

The type of control chart that is created—p, np, c, or u—depends on how data is entered:
|
If you are counting: |
Constant sample size, use: |
Changing or varying sample size, use: |
|
Nonconforming units (NCU) |
np chart |
p chart |
|
Counting Defects |
c chart |
u chart |
A Control Detail table displays data and traceability information of defects for any given point using a table format.
You can add or change the statistics for columns on a Control detail table. See Control detail columns = for more information.

You can use a simple technique called "data brushing" to select any number of consecutive data points on a line chart. Then, select from options that allow you to focus on just that data or to exclude it from the retrieval.
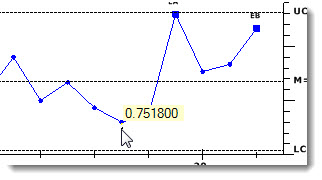
Click anywhere on a data point on a line chart to display its value as shown in Fig. 1.
Click on any limit line to display the value for that limit as shown in Fig. 2. This can be useful on charts with grouped limits.
Fig. 1 Fig. 2
Depending on how your GainSeeker is configured, certain access rights may be required to use this function.
For information on editing data, data notes, and more, see: