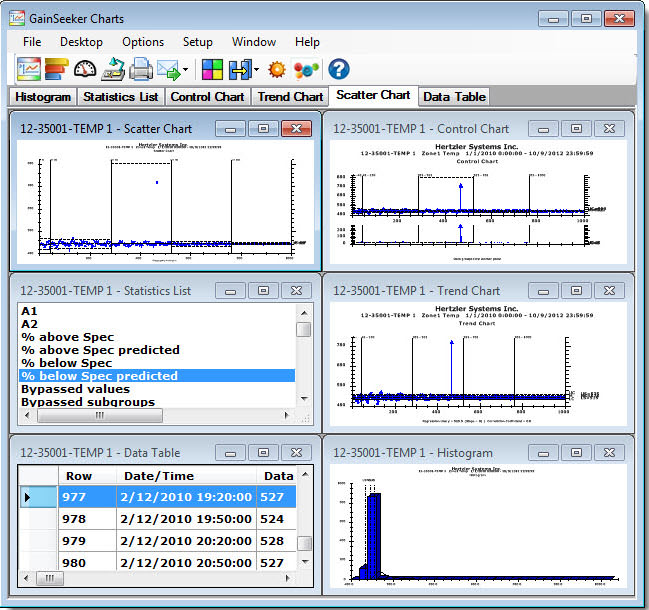
If you plan to work with more than one chart or dashboard on the GainSeeker Charts window, you may want to familiarize yourself with some of these tips and functions. They can help keep the window organized and your charting and dashboard windows easy to identify.
|
Contents [Hide] |

Any time you have charts or dashboards open on the GainSeeker Charts window, an identification tab corresponding to each chart or dashboard displays. One of the tabs will be highlighted, which visually separates it from the others (and selects that chart or dashboard). In the following example, a tab for a Control Chart is highlighted indicating that chart is selected.

You can pause over a tab to display a tooltip that shows the standard, chart type, or other information that corresponds to that tab. This can be helpful when you have several dashboards or charts open on the window at the same time.

You can also click a tab to identify the chart or dashboard* that corresponds to it. The window frame for the corresponding chart or dashboard will highlight. You can also click anywhere on an open chart or dashboard and the corresponding tab will highlight.
*To name dashboard windows, which also names the tab for that dashboard window, see using the Caption property.
| To | Do this | |
| Close only the selected chart or dashboard: |
-or-
|
Fig. 1  Fig. 2 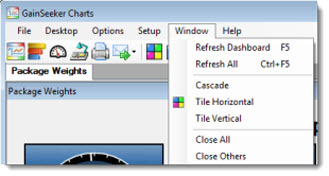 Fig 3. 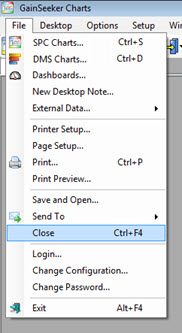 |
| Close all open charts or dashboards open on the GainSeeker Charts window except the one that is selected: |
-or-
|
|
| Close all charts and dashboard windows open on the GainSeeker chart window: |
-or-
|
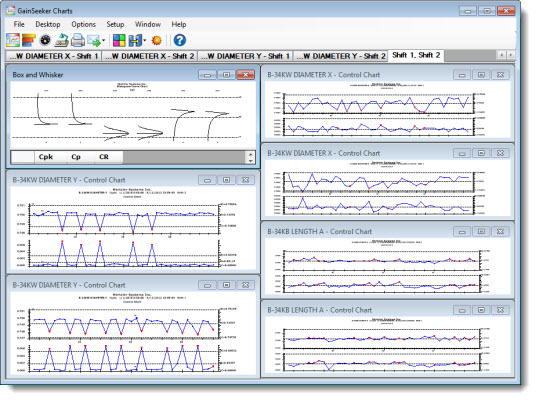
Use the Tile function to rearrange two or more charts or dashboards on the GainSeeker Charts window so they do not overlap. This allows for optimized viewing of each.

-or-
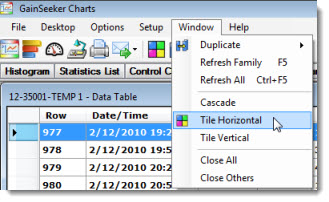
The charts or dashboards reposition on the window. A scrollbar displays if there are more charts or dashboards than can easily fit in the window at one time.
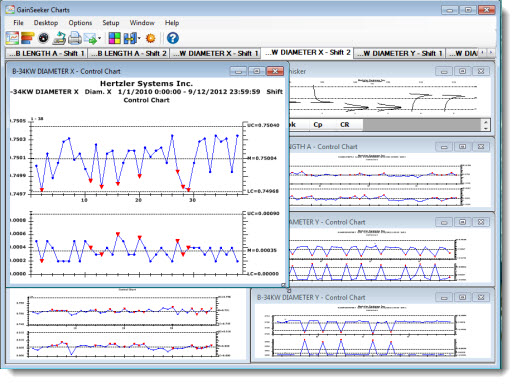
You can drag the corner of a window frame to make a chart (or dashboard) larger if you want to have a larger view of any of the charts on the window, such as in the following example. When you are finished viewing it, you can return the charts to tile view using one of the methods mentioned above. Also see Maximizing the chart windows, which follows in this topic.
You can maximize the size of all of the open chart and dashboard windows. When a chart or dashboard window is maximized, it fills the GainSeeker Charts window. Maximizing one chart or dashboard window maximizes all other windows that are also open at that time on the GainSeeker Charts window. Additionally, any new windows you add while in maximized mode will be maximized on the GainSeeker Charts window (until you exit the GainSeeker module and reopen it. When you reopen the module, the windows return to the default normal size window mode).

To maximize all windows open on the GainSeeker Charts window:
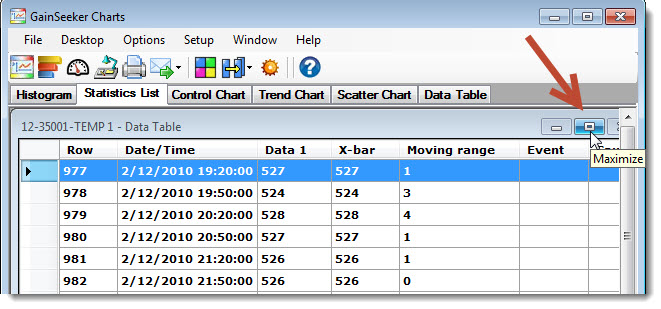
That chart is maximized and the Restore button now displays in the GainSeeker Charts window menu field:
