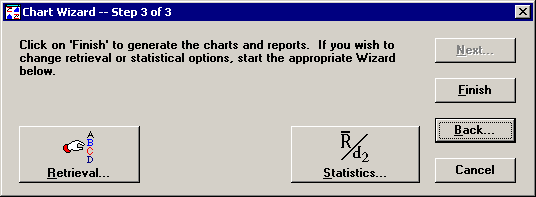
Chart Wizard Step 3 allows you to choose retrieval options and statistical options for your charts and reports.

Retrieval options determine which data points will be retrieved and analyzed by setting a maximum count of data points, the range of dates, and filtering for particular traceability values.
You can also set advanced retrieval options such as measurement system conversion, sampling for every nth record, converting subgrouped data into individual data (subgroup size of 1), or retrieving only the nth measurement in each subgroup.
To explore these options, click the Retrieval button. For more information, see Setting Retrieval parameters.
Statistical options allow you to choose whether or not statistical outliers are included in the data analysis, which method to use when assessing standard deviation, and which options to use for data that is normally and non-normally distributed.
To explore these options, click the Statistics button. For more information, see Setting Statistical parameters.
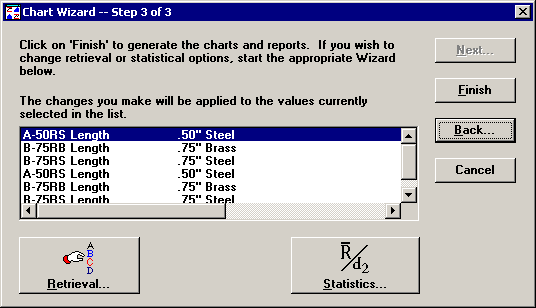
If you selected Analysis Mode 2 on Chart Wizard Step 1, this screen will look slightly different:

In this case, you should select one or more values for which to set specific retrieval and statistical options. Each set of retrieval and statistical options can be applied to the values highlighted on this screen or to all the values in the list.
If you have already selected your part numbers or Short Run process specifications on Chart Wizard Step 1 and the types of charts on Chart Wizard Step 2, you can choose to draw your charts and reports without changing either the retrieval options or the statistical options.
When you are satisfied with your selections of part numbers or Short Run process specifications, chart types, and retrieval and statistical options, click the Finish button to draw the charts and reports you have chosen.