![]() Launch the SPC Charts and Reports module, and log in as a user or group name with rights to use this module.
Launch the SPC Charts and Reports module, and log in as a user or group name with rights to use this module.
After logging in to the SPC Charts and Reports module, there are several ways to start Chart Designer:
-
On the Start screen, click the Chart Designer button
 .
.
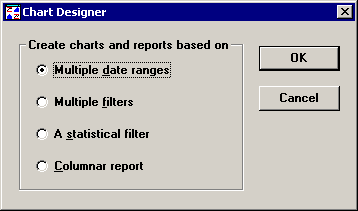
Then select the type of chart you want to create.
