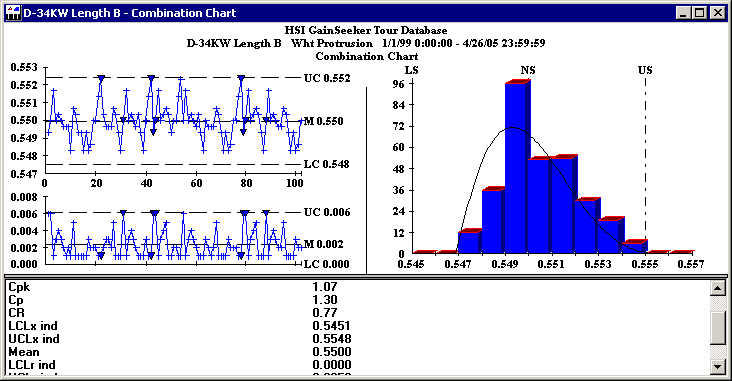
This chart will show a combination of charts on one screen. It shows a control chart and a histogram at the top with a summary statistics list at the bottom.

To change the statistics displayed on the combination chart, see Changing the statistics printed after charts.