For new installations of GainSeeker 7.5 or higher, this chart is labeled Box & Whisker on the list of chart types. For previous installations of GainSeeker that have been upgraded to version 7.5 or higher, the name of this chart is Multiple Capability on the list of chart types. For all installations, this chart is referred to as a Process Capability chart when the chart is displayed on the screen.
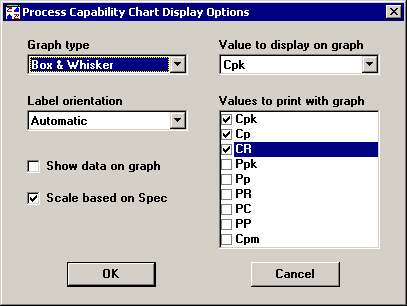
You can change the way that the Process Capability chart is displayed. Click the Options menu and then click Display Options, or right-click on the chart and then click Display Options. This displays the Process Capability Chart Display Options screen.

Graph type
This setting determines how the data distributions are displayed on the chart. Options for this setting are Histogram, Box & Whisker, Box or Centered Box.
A minimum of five data values are needed to display a Box & Whisker chart for a data distribution. These could come from five or more data records with a subgroup size of 1, three or more data records with a subgroup size of 2, two or more data records with a subgroup size of 3 or 4, or one or more data records with a subgroup size of 5 or more.
Label orientation
This setting determines how the labels for each data distribution are displayed. You may choose to display the labels horizontally, vertically, or allow GainSeeker to automatically choose the best option based on readability.
Show data on graph
To display a representation of the actual data on your Histogram, Box & Whisker, Box or Centered Box chart, select this check box.
Each point on the chart represents one or more instances of data with that particular value. This can be helpful for viewing where actual data values fall relative to specification limits. However, because these points do not indicate frequency of data at particular values, 10 instances of value x and 1000 instances of value y will each be plotted with one point on the chart.
To remove the representation of data from the chart, clear this check box.
Scale based on Spec
To scale the chart based on specification limits, select this check box. This displays the spec limits in a fixed position and then displays the data distributions relative to those limits. Data distributions that extend beyond the specification limits may not fit inside the chart window.
To scale the chart based on the spread of the data and on the specification limits, clear this check box. This sizes and positions the data distributions so that they fit inside the chart window.
Value to display on graph
You must choose one statistic, such as Cp or Cpk, to be displayed for each data distribution.
To choose a statistic that is not displayed in this list, edit the Cms.ini to replace any or all of the last three statistics in this list with statistics that you choose. For more information on how to change the Cms.ini settings multcap_1=, multcap_2= and multcap_3=, see Using the Cms.ini to specially configure the workstation. Please note that these settings also apply to the list of Values to print with graph.
Values to print with graph
As noted above, only one statistic can be displayed for each data distribution on the Process Capability chart window. However, you can specify additional statistics to be included when you print the chart.
To choose a statistic that is not displayed in this list, edit the Cms.ini to replace any or all of the last three statistics in this list with statistics that you choose. For more information on how to change the Cms.ini settings multcap_1=, multcap_2= and multcap_3=, see Using the Cms.ini to specially configure the workstation. Please note that these settings also apply to the list of Values to display on graph.