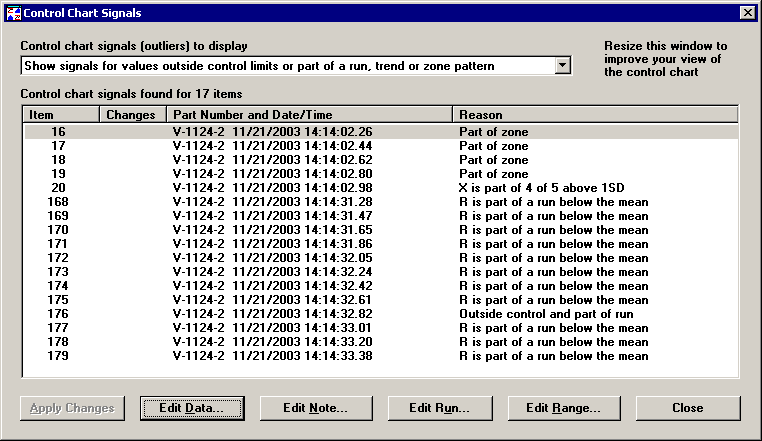
If you want to identify data as special causes, you can select Manage All Chart Signals from the Options or right-click menu on a Control chart. You can also jump to this dialog from the first step of the Variation Wizard.
Because values associated with Special Causes make it difficult to predict what the process will do in the future, it is a good idea to bypass these values. There are two options for bypassed data
Values can be shown on charts and data listings but not included in the statistics
Values do not show up at all in a data retrieval
The Control Chart Signals dialog shows you what type of signals are shown on the chart, a list of the items included in these signals, and their reasons.

You can change the items shown in the list and on the chart by selecting a different option for Control chart signals to display. If you change the signals to display, you must click the Apply Changes button to refresh the list and chart. Signals could be one or more of the following:
X-bar or range values outside control limits
A run of X-bar or range values above or below the mean
A trend with X-bar or range values increasing or decreasing
2 out of 3 X-bar values above or below two sigma
4 out of 5 X-bar values above or below one sigma

To view the chart behind the dialog, you can drag the dialog out of the way or make the height smaller to help display more of the chart.
If you suspect that a signal is the result of a data entry error, you can click the Edit Data button to view and correct the data values. If any changes are made to the data, you may refresh the list and chart by clicking the Apply Changes or Apply and Close buttons.
You can mark items as special causes in several ways:
Click Edit Note to change the bypass status on the note dialog
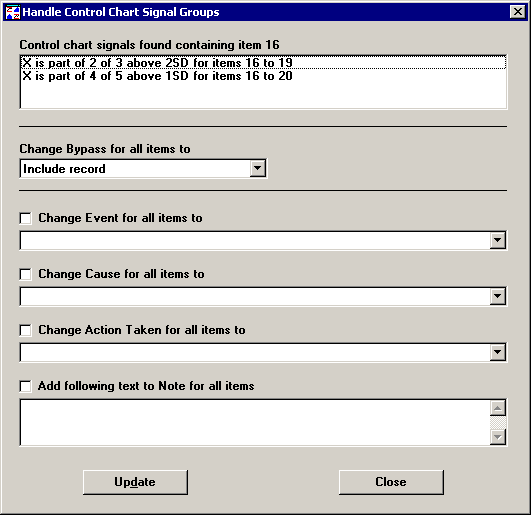
Click Edit Run to change the bypass status for all items in a run at once
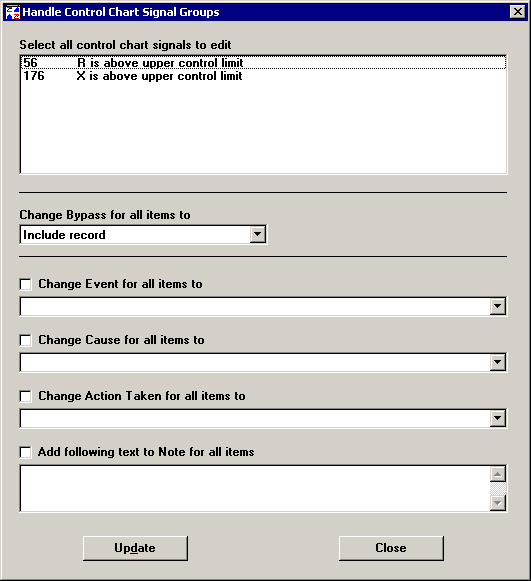
Click Edit Range to change the bypass status for multiple items at once
Edit Note allows you to set the bypass status, event, cause, action taken, note and anchor point status for the selected item. If any changes are made to the bypass status or note, you may refresh the list and chart by clicking the Apply Changes or Apply and Close buttons.
Edit Range allows you to pick multiple items and set values for bypass status, event, cause, and action taken all at once. You can also append the same text to the note for each item. . If any changes are made to the bypass status or note, you may refresh the list and chart by clicking the Apply Changes or Apply and Close buttons.

Edit Run identifies the items that make up a control chart signal for a run, trend or zone pattern. If a selected item is not part of one of these patterns, the option will not be enabled. You can set values for bypass status, event, cause, and action for the entire pattern at once. You can also append the same text to the note for each item. If any changes are made to the bypass status or note, you may refresh the list and chart by clicking the Apply Changes or Apply and Close buttons.
