Step 4 in the Pareto Chart Builder is to select specific defects to retrieve. You can specify retrieval of only defects or use the program’s filtering options to narrow your choice. You can also include statistics. At the end of this step, select Finish, and you will see the charts you have selected. Once you have one of these charts displayed, you can use the unique drill-down feature to analyze the data in more detail.
You can further narrow your retrieval by using the Filter Tab or the Defect tab.
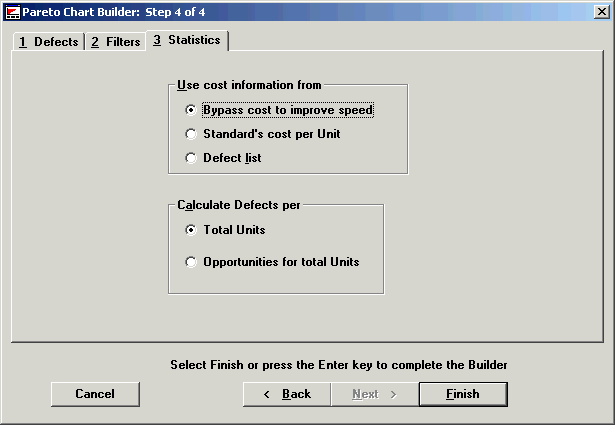
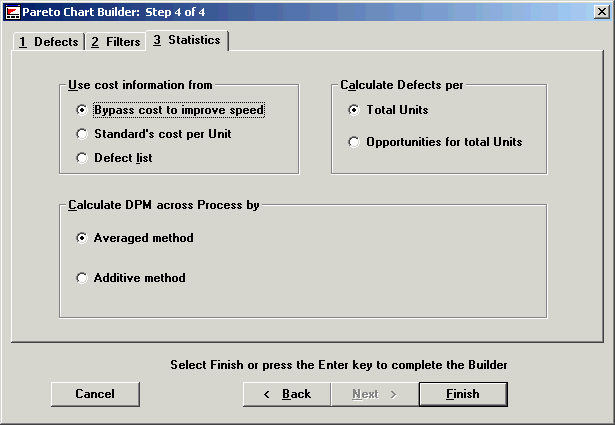
Use the Statistics tab to calculate the cost of a part (Standard’s cost per unit) or each kind of defect (Defect list) or Bypass cost to improve speed. The default is Bypass cost to improve speed.
When you choose One Process, One Part from the Start Screen, the Statistics tab displays an additional frame.

When you choose Multi-Process, Multi-Part Number or One Process, Multi-Part Number from the Start Screen, the Statistics tab presents these options.

Standard’s cost per unit: You associate a cost with a part, e.g., if we make a bad widget, the sunk cost (i.e., the money lost), at this point in the manufacturing process is $5. In that case, the cost is associated with a specific part and put in the standard record for the widget. The cost of the part is established in setup.
Defect list: You associate a cost with each kind of defect, e.g., scratches cost us $.75 a piece. This method is typically used to track standard repair costs. In that case, the cost is put in the defect list. Each defect was assigned a cost during setup. Calculations will be based on this value.
Bypass cost to improve speed: If you don’ t care about cost, it is faster to use this option. Because the system doesn’ t have to search each standard for cost information, it runs faster.
Calculate Defects per
Total units: Uses the sample size you are charting.
Opportunities for total units: Multiplies the sample size by the number of opportunities set in the standards.
Calculated DPM across Process by:
Average method: Defects per million = Sum of all process defects, divided by the sum of all units, multiplied by 1,000,000.
Additive method: Defects per million = DPM (process 1), Plus DPM (process 2), Plus DPM (Process n)
After you have made your selections from the Defects, Filters and Statistics tabs, click Finish to see your chart.