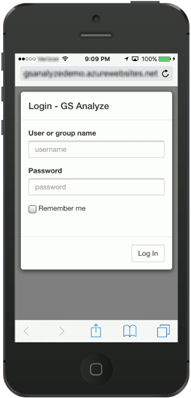
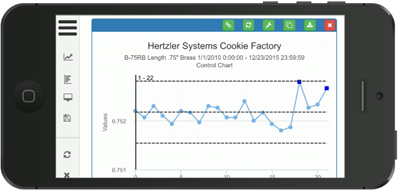
You control who can log in to GS Analyze by creating Users that have a Role with Module Access permission for GS Analyze. Be sure to set up login passwords for those Users.
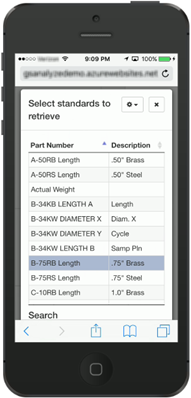
You can also set up priority lists of standards for these Users and set their Configuration(s) so that these Users are prevented from accessing the full list of standards.
Your web server administrator will inform you of the exact address for your GS Analyze login page.
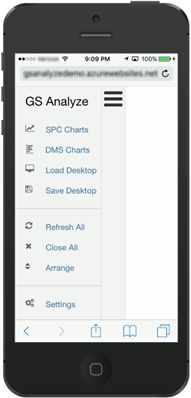
Touch the menu button  to show the names of the menu items.
GS Analyze is optimized for browsers on tablets and smart phones as well as PCs. Supported browsers include Google Chrome versions 47 and later, Mozilla Firefox versions 43 and later, Internet Explorer versions 9 and later (including Microsoft Edge), and Safari versions 9 and later.
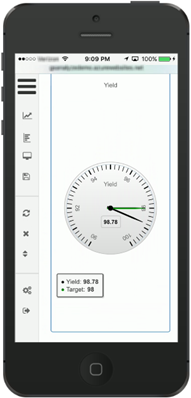
Instead of choosing a typical Control Chart or Pareto Chart, you can create a Dial gage for a numeric statistic. When creating or modifying the dial gage, you can use Gauge Settings on the last step to choose a statistic, scaling information like minimum and maximum, and region colors.
The chart builders for SPC and DMS charts don't have all the settings available in the full GS Charts module, but most key options for retrieving and showing data are available. Touch or click the Next and Previous buttons at the bottom of the builder pages to become familiar with the available settings. The Chart settings on the last step will change based on the chart type(s) you selected earlier.
When a chart is displayed, you can use the green buttons in its header to:
-
Expand the chart to nearly full-screen (not available on some smart phones).
-
Get a link to this chart. You can copy this link and email it to someone else who needs to review this chart.
-
Refresh the data and statistics on the chart.
-
Change the settings for the chart.
-
Duplicate this chart to another chart window; you can even apply changes to the new chart before it has been drawn.
-
Download the chart to an image file.
Desktops you save in GS Analyze cannot be opened in the GainSeeker Charts module. However, GS Analyze can often open desktops that were saved in GainSeeker Charts.
When multiple charts are open, you can click the Arrange button  and then change the order of the charts shown in your browser.
You can click a bar on a Pareto chart to begin drill-down analysis.
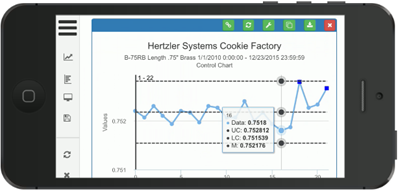
On a Control Chart, you can click a point that had real-time failures to see what failed for that point. You can also hover over a data point to view its value and the values of any limits and lines displayed (such as Control Limits and X-bar).
