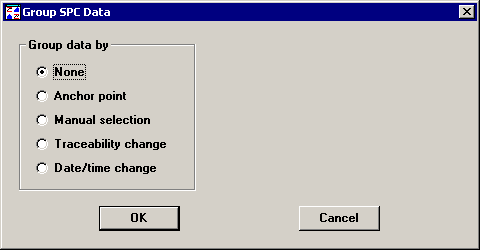
When a control chart is displayed on your screen, you can change the way that data is grouped for control limit calculations on your control chart.
To do so, right-click on the chart and then click Group Data. Alternately, choose Group Data from the Options menu (in the SPC Charts and Reports module) or from the Chart Options menu (in the SPC Data Entry module) . This displays a window similar to the following example:

More:
Grouping data by anchor points
Grouping data by manual selection