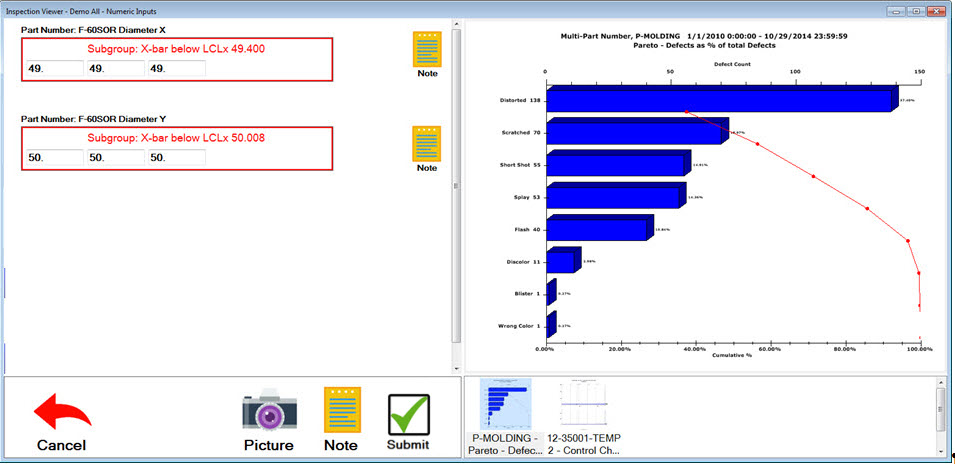
You can set charts to display during a PC Collect inspection. The charts can optionally be emailed to recipients when a real-time failure occurs.
In this example, a Pareto chart is displayed when this sub-inspection opens. The inspector could alternately click the other thumbnail image to display the other chart.

You will define the charts to display for each sub-inspection.
Begin by clicking either of these sub-inspection properties using the Inspection Editor:
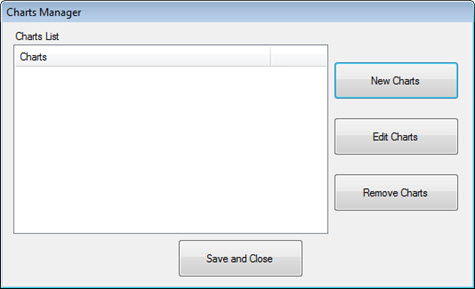
ChartOptionsDMS - When you click this property, the DMS Charts Manager window displays.
ChartOptionsSPC - When you click this property, the SPC Charts Manager window displays.

From the DMS (or SPC) Charts Manager window, you can edit or remove existing chart groups that display in the Charts List or you can create a new chart group.
Clicking New Charts or Edit Charts will display the DMS Chart Options or SPC Chart Options.