Requirements for collecting OEE data
Special prerequisites and requirements apply when collecting OEE (Overall
Equipment Effectiveness) data.
Prerequisites to collecting OEE data
1. Create OEE traceability
fields
Use the System Administration module to create five new traceability
fields for raw OEE data:
Select five consecutive traceability fields (for example, fields
7–11) that are
not previously used.
Assign a label to each of those traceability fields in this
order:
Available Time
Scheduled Time
#Good Parts
#Total Parts
Ideal Cycle Time
For detailed instructions on creating traceability labels, see Adding
traceability field labels.
2.
Change an OEE Statistic setting
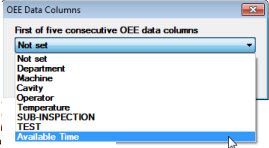
Use the System Administration module to designate the first of these
new traceability fields for special use as OEE data:
In the System Administration module, navigate to this setting:
Configurations tab | configuration name | Statistics
| OEE | First
of five traceability columns where OEE values are stored =
Right-click the First of five
traceability columns where OEE values are stored = setting,
then choose the new Available Time
traceability label.

Then click OK.
Requirements for entering OEE
Data
Use one of the many GainSeeker data entry options - PC Collect,
SPC Data Entry, DMS Data Entry, etc. - to enter OEE data for analysis.
Store OEE data as DMS data
records (not SPC data).
Important data fields are the Date/Time stamp, the new traceability
fields you added (above), and other traceability fields.
Date/Time
stamp
This relates to the frequency of data collection and determines
the smallest unit of time that you can use for comparing OEE values
- every 5 minutes, every 30 minutes, every hour, every day, etc.
For example: if you want the ability to calculate separate OEE
numbers for increments as small as every 30 minutes, then you
need to enter data records that are timestamped 30 minutes apart.
Also, each timestamp should fall within the time period it represents
- e.g., for OEE data from 10:00:00 - 10:30:00, the data record
should be timestamped between 10:00:00 and 10:29:59.
New
traceability fields
Available Time:
The length of time*
that the process was actually producing parts. For example,
if you are storing time values in Minutes, and the process
ran for 5 hours, then you would enter 300
(the number of minutes). This number should not include any
time that the process was unable to produce parts - either
for scheduled reasons (see below) or for unscheduled reasons
such as machine setup and changeover, equipment malfunction,
or material shortages.
Scheduled Time:
The length of time*
that the process was scheduled for production. For example,
if you are storing time values in Minutes, and the process
was scheduled to run for 8 hours, then you would enter 480 (the number of minutes).
Any scheduled downtime - preventive maintenance, employee
lunch breaks, etc. - should not be included.
#Good Parts:
The number of parts that were produced without defects (first-pass
yield). Reworked parts should not be included.
#Total Parts:
The total number of parts produced within the set time period
(good parts and bad parts).
Ideal Cycle Time:
The length of time*
to produce one part, when the process is running as fast as
it was designed to perform. For example: if you are storing
time values in Minutes, and your process is designed to produce
240 parts per hour, which is 4 parts per minute, or 1 part
every 15 seconds, then you would enter 0.25
(the number of minutes to produce one part).
*
The Available Time, Scheduled
Time, and Ideal Cycle Time
must all be entered with the same unit of time. Minutes are most common,
but you can use Seconds, Hours, etc. - as long as you use the same unit
consistently.
Other traceability fields
In addition to the OEE-specific traceability fields, your OEE data
records can also store information in the other traceability fields.
This will allow you to group OEE metrics by other traceability
values - e.g., by part family or work order - instead of (or in
addition to) analyzing that data by time period.
(optional) You may
also enter "typical" DMS data in these records - sample
size, number of good units, number of nonconforming units, defects
and counts. The OEE charts will not analyze this information,
but you can still use DMS charts to analyze this data.
In particular, consider setting up defects for Availability issues
such as machine setup and changeover, equipment malfunction,
or material shortages. During data entry, you could flag any downtime
events with the corresponding defect, and enter the number of downtime
minutes for that downtime event as the defect count. This ultimately
allows you to perform Pareto analysis on the downtime defects in your
OEE data.
You could attempt a similar approach for Performance issues. Or, if
these are too difficult to identify (and they often are), you could
still set up a "Performance Loss (Minutes)" defect and enter
the number of minutes lost due to slow performance. For every OEE
data record, this can be calculated as Available
Time - (#Total Parts * Ideal
Cycle Time) , with the caveat that this number cannot be less
than 0.
See also
