 Note: Limits to Display settings and all other settings in the Chart overrides node on the Settings dialog can be saved as a chart skin. See Chart Skins for more information.
Use the Limits to Display options under the Lines and Limits node on the Settings tab to temporarily set the limits to display on DMS Control charts and DPU charts.
You can also assign default settings to charts in the GainSeeker System Administration module. See Chart Defaults settings
 Note: Limits to Display settings and all other settings in the Chart overrides node on the Settings dialog can be saved as a chart skin. See Chart Skins for more information.
|
Contents [Hide] |
To navigate to Limits to display:
Chart overrides | Lines and Limits | Limits to display | Control charts limits (or) DPU chart limits (or) OEE chart limits

Configurations | "Configuration" | Chart defaults | DMS (or OEE) | Control charts (or) DPU charts (or) OEE chart limits
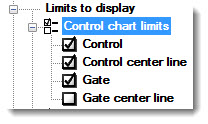
Displays these limits on a Control chart. Click a checkbox to select it or to clear it.

Control. Displays control limits calculated from retrieved data and the method used to calculate control limits. (These labels display on chart: UC [upper control limit], LC [lower control limit]. The labels can be changed in the GainSeeker System Administration module.)
Control center line. Displays the mean calculated from the retrieved data. (This label displays on chart: M. This label can be changed in the GainSeeker System Administration module.)
Gate. Displays the gate limits (the historical control limits for this characteristic) from the standard (or part number) for which data is being charted. (These labels display on chart: UG [upper gate] LG [lower gate]. The labels can be changed in the GainSeeker System Administration module.)
Gate center line. Displays the midpoint between the gate limits from the standard for which data is being charted. (This label displays on chart: NG. This label can be changed in the GainSeeker System Administration module.)
Displays these limits on a DPU chart. Click a checkbox to select it or to clear it.
Acceptable. Displays the Acceptable Yield setting from the current DMS standard (if set). This will not be displayed when charting data for multiple standards.
Control. Displays control limits calculated from retrieve d data and the method used to calculate control limits. (These labels display on chart: UC [upper control limit], LC [lower control limit]. The labels can be changed in the GainSeeker System Administration module.)
This setting is ignored for DPU charts with second-level grouping.
Control center line. Displays the mean calculated from the retrieved data. (This label displays on chart: M. This label can be changed in the GainSeeker System Administration module.)
Goal. Displays the Goal Yield setting from the current DMS standard (if set). This will not be displayed when charting data for multiple standards.
Displays lines for these limits on an OEE chart. Click a checkbox to select that option or to clear it.

These labels display on charts: A for Acceptable, and G for Goal. These labels can be changed in the GainSeeker Systems Administration module.