Columns tab

A dashboard for real-time failures will contain one or more columns - each representing a different date range or number of most recent data points. To design the dashboard, use the Columns tab to define at least one column.

To define one or more columns:

  1. Browse the Available date periods or count list to determine the range of data that should be represented by this column.

For information on applying additional limits to the data retrieved for this column, see Limiting counts and dates for SPC data.

  1. Click the desired period or count in the Available date periods or count list, and then click Add. Alternately, you may double-click the desired period or count.

    If you chose Custom by date, you will be prompted to specify a low and high date and time. For more information, see Set Date Range screen.

  2. The item you chose is added to the Selected date periods or count list.

  3. While this item is highlighted in the Selected date periods or count list, you can set the options for this column:

Options available on the drop-down list include:

text item:

explanation:

Data count

The total number of data records retrieved for each row of the dashboard.

Real- time failure count

The total number of real-time failure records retrieved for each row of the dashboard.

Total values

The total number of data measurements retrieved for each row of the dashboard

Sparkline

Chart
Chart (2x height)
Chart (4x height)

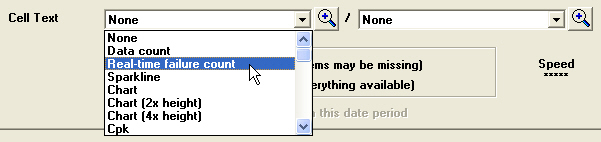
Charts of the data retrieved for each row of the dashboard.

Chart scaling:

 The Sparkline is always scaled to the minimum and maximum data points, and no limits (e.g., Control or Gate) are displayed.

 The Chart, Chart (2x height) and Chart (4x height) are scaled according to data points and/or limits as follows:

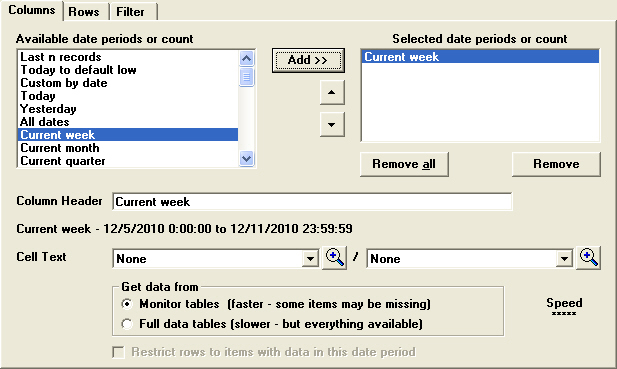
Choosing the limits:
If the chart defaults for the current configuration are set to display Gate limits but not Control limits, then these charts will use the Gate limits and/or data to scale the chart. Otherwise, these charts will use Control limits and/or data to scale the chart.

Scaling the top of the chart:
The top of the chart will be scaled to the maximum data point or the upper limit, whichever is higher. (If using Gate limits and the upper Gate limit is not set for this standard or process specification, then the top of the chart will be scaled to the maximum data point.)
The upper limit will be only displayed on the chart if the maximum data point falls above this limit.

Scaling the bottom of the chart:
The bottom of the chart will be scaled to the minimum data point or the lower limit, whichever is lower. (If using Gate limits and the lower Gate limit is not set for this standard or process specification, then the bottom of the chart will be scaled to the minimum data point.)
The lower limit will be only displayed on the chart if the minimum data point falls below this limit.

Chart height:

 The Sparkline and Chart are sized to the same height as the font used for the dashboard.

 The Chart (2x height) is sized to two times the height of the font used for the dashboard.

 The Chart (4x height) is sized to four times the height of the font used for the dashboard.

Chart width:

The chart width is automatically sized to six times the height of the chart. This can only be changed by viewing the dashboard, dragging the column header to change its width, changing the design of the dashboard and locking the column width.

The data mean is displayed on all charts.

You cannot change the colors or line types used to display the data or limits.

Note: For a Real-time Failure or Statistical Filter dashboard that includes items such as Sparkline, Chart, Chart (2x height) or Chart (4x height):
When sending one of these graphical dashboards to any destination except XML, GainSeeker will maximize this dashboard and then take a picture of the portion of your Dashboard screen that is currently visible on your monitor. If the entire content of this dashboard cannot be displayed on your monitor at one time, you may wish to increase your screen resolution, choose the smaller chart items (Sparkline or Chart), choose a smaller default font size for tables in the Enterprise Dashboard module, and/or redesign your dashboard to display fewer rows or columns.

Cp
Cpk
Pp
Ppk
% above Control
% below Control
% out of Control
% above Spec
% below Spec
% in Spec
PPM out of Spec
Mean

Statistics calculated from the data records retrieved for each row of the dashboard.

Some of these statistics, such as Cpk, can only be calculated if at least one specification limit is defined in the SPC standard or Short Run process specification that defines this row of the dashboard. If no specification limit is found for a row, these text items will display "NA".

If you have configured different labels for these statistics, your labels will be displayed instead of those shown here.

If the item you want to display is not available on the drop-down list, click the button to select from the full list of statistics.

Nominal Spec
Lower Spec
Upper Spec
Lower Ind. Gate
Upper Ind. Gate
Lower Gate
Upper Gate

Limits set in the SPC standard or Short Run process specification that defines this row of the dashboard.

If no SPC standard or Short Run process specification exists for a row, these text items will display "None".

If you have configured different labels for these limits, your labels will be displayed instead of those shown here.

If the item you want to display is not available on the drop-down list, click the button to select from the full list of statistics.

Last traceability label 1
Last traceability label 2
etc.

The traceability value from the most recent data record retrieved for this row of the dashboard.

These text items will reflect the traceability labels that are configured for your system.

Last Time
Last Date

The time or date from the most recent data record retrieved for this row of the dashboard.

Last Part Number

The name of the SPC standard from the most recent data record retrieved for this row of the dashboard.

If you have configured a different label for standards, your label will be displayed instead of "Part Number".

Last X-bar

The subgroup average from the most recent data record retrieved for this row of the dashboard.

If the item you want to display is not available on the drop-down list, click the button to select from the full list of statistics.

Note: Some items will use a slower type of data retrieval than others. The number of stars displayed for Speed – where ***** is the fastest type and * is the slowest type – will indicate the relative speed of your choices.

  1. To define additional columns, repeat the steps above.

    When the dashboard contains multiple columns, you may need to consider additional issues: