When a chart is displayed on your screen, you can change the colors, fonts, and font properties used for the chart.
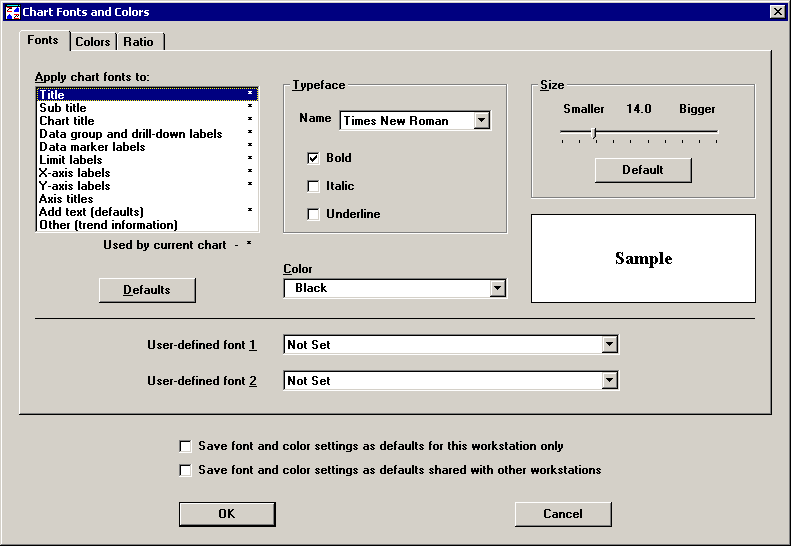
To change these settings, right-click on the chart and then click Fonts and Colors. Alternately, choose Fonts and Colors from the Options menu (in the SPC Charts and Reports module) or from the Chart Options menu (in the SPC Data Entry module) . The following window will appear:

You can use this window to change settings for the current chart only, for the current chart and all future charts generated from this workstation, or for the current chart and all future charts generated from other workstations.
This feature is not available in PDA mode or for MINITAB chart windows.
More:
Changing font properties of text items
Changing colors of non-text items