 for the DeviceProfile property. Then choose a Device Profile from the list and click Select.
A Device Profile defines the settings needed to communicate with one type of device on a particular COM port.
In the Properties for a Numeric Input test, click the ellipsis button  for the DeviceProfile property. Then choose a Device Profile from the list and click Select.
Clicking Select also saves changes to the current Device Profile and selects it for the current Numeric Input test.
To remove the Device Profile from the Numeric Input test and return to keyboard-only entry, select the Device Profile <<None>> at the top of the list. Alternately, you can use the BACKSPACE key or DEL key to clear the text of the DeviceProfile property.
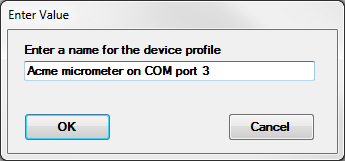
Click the New button and enter a descriptive name for the Device Profile.

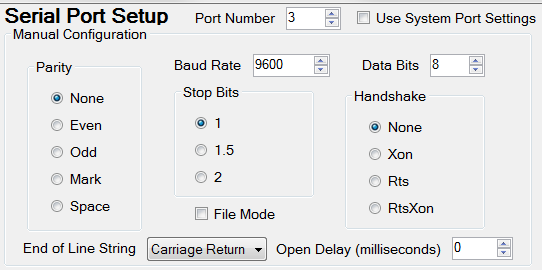
In the Serial Port Setup area, choose a COM port and communication settings.
You can either use the System Port Settings (computer settings for the selected COM port – configured in the Control Panel, Device manager) or set the Manual Configuration area to match the communication settings documented for your RS-232 device:

Use the Testing area to verify that your device can communicate with the computer:

Click Connect to begin communication via the selected COM port.
Then get one or more test readings:
Press a button or footswitch on the device to send data to the computer
Type a device command (from your device documentation) in the Test Write box and then click the Test Write button
If your device is configured to send a continuous stream of data, that data will be displayed immediately
If your device sent data to this COM port before you clicked Connect, it will be displayed immediately.
This step takes place on the Profile Setup tab.
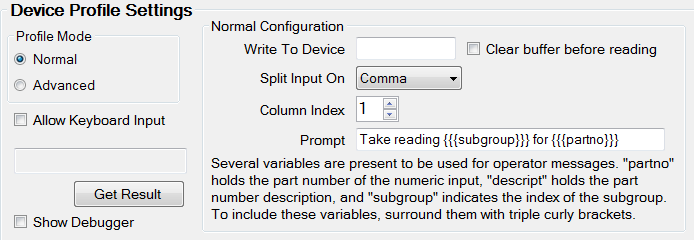
With Profile Mode set to Normal, you can easily configure additional settings for reading RS-232 input strings, writing output strings, extracting your data value from the input string, and prompting the user for readings.

Same as the Test Write box above, but stored in the Device Profile and used when the Inspection user (or a Python script) triggers a reading from the device.
If your device is configured to send a continuous stream of data, this configures the Device Profile to first clear the input buffer for the specified COM port, and then process the first reading after the buffer was cleared.
If the input string from your device contains more than just the measurement value (like the Testing example above), first designate whether the values in that input string can be separated into "columns" by commas or spaces.
Then indicate which column contains your measurement value. (Empty columns are ignored when counting the columns.)
 Note: The Column Index begins numbering at 0. So the first value in the string is column 0, the second value is column 1, etc.
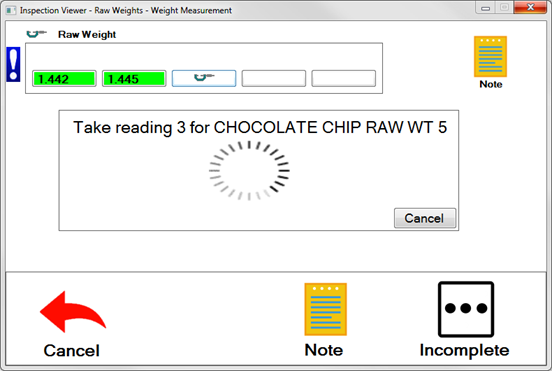
When the Inspection is waiting for the device to send a reading, a user prompt will be displayed.
You can customize the user prompt with your own message. This can include placeholders {{{subgroup}}} (which measurement in the subgroup - 1, 2, etc.), {{{partno}}} (name of the SPC standard), and {{{descript}}} (Description of the SPC standard).
For example, the Prompt setting Take reading {{{subgroup}}} for {{{partno}}} will display a prompt like this during data entry:

When enabled, this setting allows the user to temporarily switch to Keyboard input by pressing CTRL+K at this type of prompt:

The prompt then changes to look like this:

At this Keyboard Input prompt, the user can type a measurement, press CTRL+K to change back to RS-232 mode, or click Cancel to pause data entry.
On the Device Profile window, click Get Result to see how (and if) your settings will work.
If you see a prompt like the one below, use your device or other hardware (such as a footswitch) to send a reading to the computer.

If the expected reading does not display above the Get Result button, you may need to change your settings or use the Debugger and the Advanced profile mode.
The debugger can sometimes help to identify exactly which part of the generated script is not working properly. It can also show you a script that is very similar to the Python code that will be used during data entry.
To use it, select the Show Debugger check box and then click Get Result. This should open a debugger window and allow you to Step through the code or copy the generated script (e.g., for pasting into a script in Advanced profile mode).
For more information on using the Debugger, see Debug Python Scripts in GainSeeker.
Setting up your Device Profile with Profile Mode set to Normal will create a basic, functional script for interacting with your serial equipment.
If you wish to customize the script, change the Profile Mode to Advanced. This provides a window where you can enter custom Python code that will be used for this Device Profile. See Python command: Serial Port.
When you export an Inspection that uses a Device Profile – either from the GainSeeker Inspections module or from the GainSeeker Utility module – the resulting export file will contain both the Inspection and the Device Profile.
When you import an Inspection that uses a Device Profile, both items will be imported. If another Device Profile with that name already exists, GainSeeker will back up the original Device Profile and import the new one.