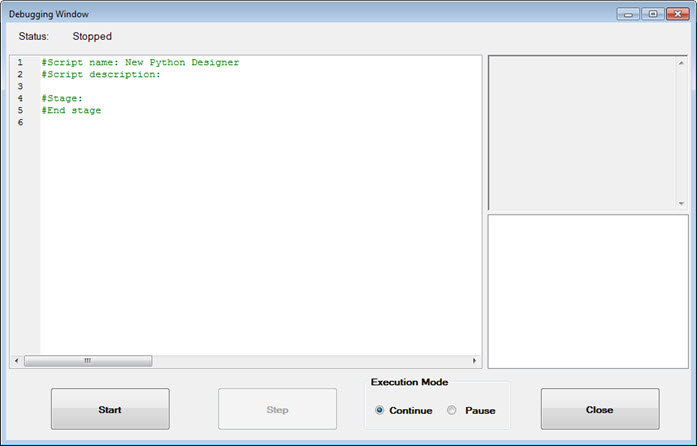
The Python script debugger opens from some windows used when you choose to create custom statistics with Python or set up a Device Profile for a numeric input test.

The debugger is used to debug Python scripts in GainSeeker. It allows you to step through the code and place breakpoints on specific code lines.
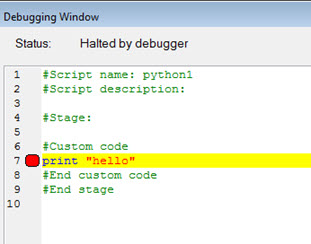
Place a breakpoint by clicking between the line number and the start of the code line.

Click Start to step through the code. Depending on your execution mode, the debugger navigates your code using one of two methods:
Continue. The debugger continues through all the code until it hits a breakpoint or the end of the code.
Pause. The debugger stops on every line of code. To move to the next line, click Step.
When a script is halted by the debugger, a list of variables displays in the lower-right region of the window. Double-click any variable to copy the value into the clipboard.
Any information printed to the console displays in the upper-right region of the window. Many commands in the GainSeeker Python Library automatically print diagnostic information to the console. If you want to print your own diagnostic information, use the print keyword when writing Python code. For example, print "my diagnostic" .