Custom code sample: use "number of decimals" to format numbers
By default, SPC data values are provided to the report as numbers. However, this means that the numbers are not formatted to the number of decimal places set in the SPC standard.
In this example, we will draft a report to display the latest 10 subgroups for each SPC standard being reported, and we will use Custom Code to format these data values according to the number of decimal places set in the standard.
Getting Started
To begin:
-
Create a new SPC report.
-
Set the retrieval settings:
-
On the Part Number tab, select one or more standards.
-
On the Settings tab, change the Maximum count for retrieval to 10. This will limit the report to retrieving information for the last 10 subgroups on each SPC standard being reported.
-
On the Columns tab, choose Part Number and Data. You can also choose any other data columns that you want to provide to the report.
-
On the Statistics tab:
-
Choose the Decimal Places statistic. (You may need to click the Show full list button to access this statistic.) This reports the number of decimals places set in the SPC standard.
You can also choose any other statistics that you want to provide to the report.
-
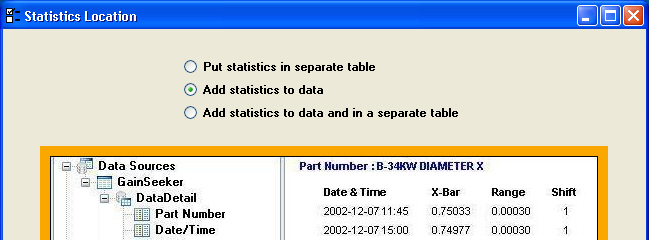
Click the Advanced button and choose either Add statistics to data (which will display an orange border) or Add statistics to data and in a separate table (which will display a blue border).
-
Click Design Report to proceed to the design window for this report.
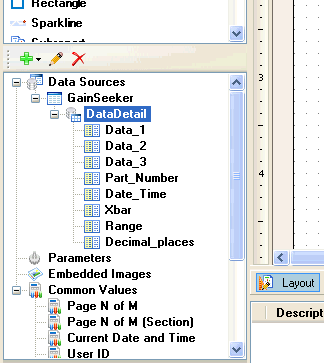
If you expand the GainSeeker\DataDetail dataset, you should see all of the items you chose on the Columns and Statistics tabs.
-
Design a list that displays the data values in each subgroup:
-
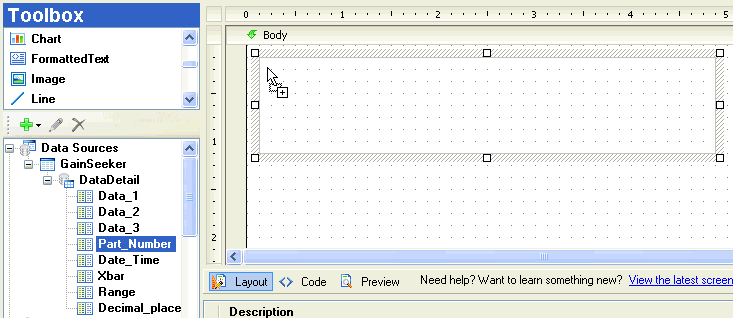
Click and drag the List item from the upper half of the Toolbox and drop it on the layout area.


-
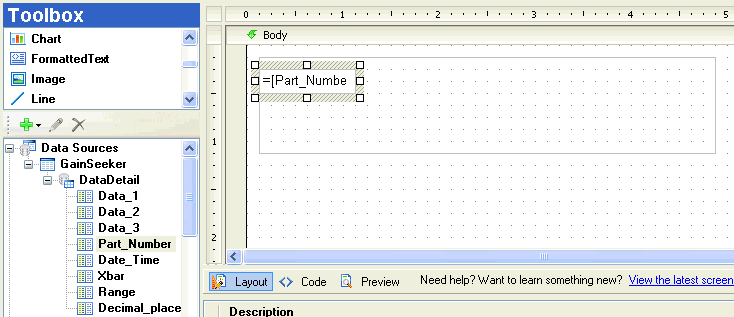
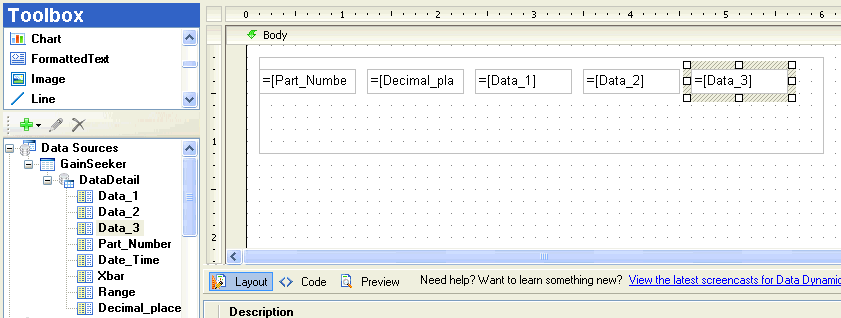
Drag the List wider, and then drag the following items from the GainSeeker\DataDetail dataset onto the list: Part_Number, Decimal_places, and all of the Data columns (Data_1, Data_2, etc. – the number of Data columns available to your report will depend on the largest subgroup size retrieved for the standards you selected in the Retrieval Settings for this report).

-
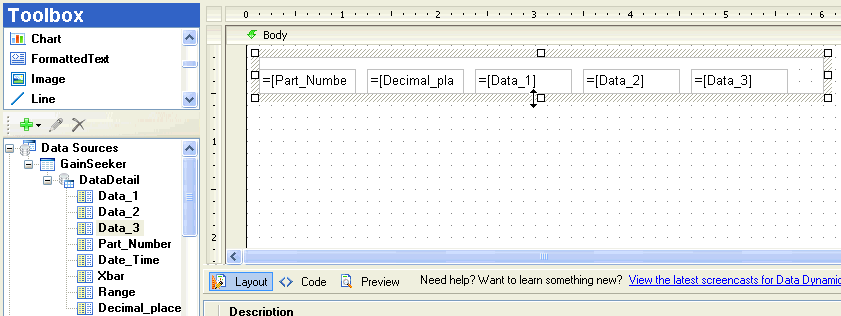
Finally, drag the List shorter. (Otherwise, there will be a lot of white space below each subgroup.)
-
On the button bar near the top of this screen, click the  button to save the report, and then click the
  button to view this draft of the report.
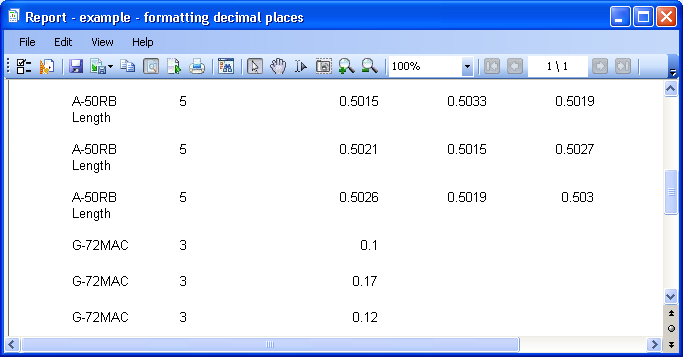
The report should display the name of the standard, the number of decimal places, and unformatted data values for up to 10 subgroups for each standard you selected:
-
On the button bar near the top of this screen, click the  button to return to the Report Designer window.
Adding the custom code
-
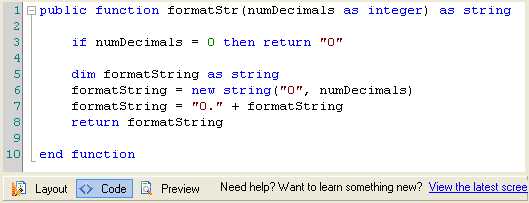
Click the  button and then paste the following text into the upper part of your screen:
|
public function formatStr(numDecimals as integer) as string
if numDecimals = 0 then return "0"
dim formatString as string
formatString = new string("0", numDecimals)
formatString = "0." + formatString
return formatString
end function
|
Your screen will now look something like this:
Using the custom code on your report
To use this custom code on your report:
-
Click the  button.
-
Click the textbox containing =[Data_1] .
This will display the property grid for this textbox on the right-hand side of your screen.
-
In the property grid, click the Format property.
Click the drop-down arrow for this property and then click <Expression…>.
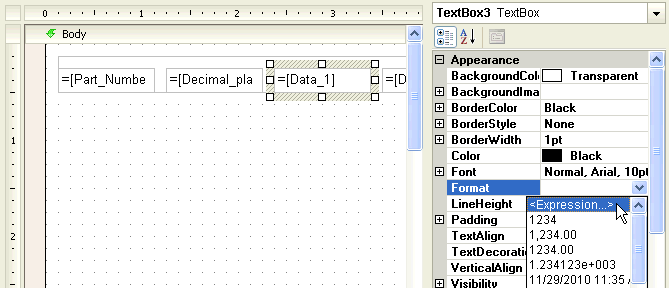
This will display the Expression Editor window:
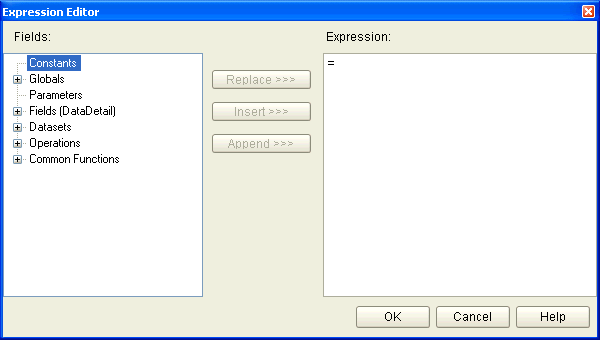
-
Delete all contents of the Expression box, and then paste =Code.FormatStr() into the Expression box.

-
Click the mouse or use the arrow keys to place your cursor between the parentheses in the Expression box.
-
In the Fields list, expand the Fields (DataDetail) node of the tree.
-
In the Fields (DataDetail) node of the tree, click Decimal_places and then click the Insert button.
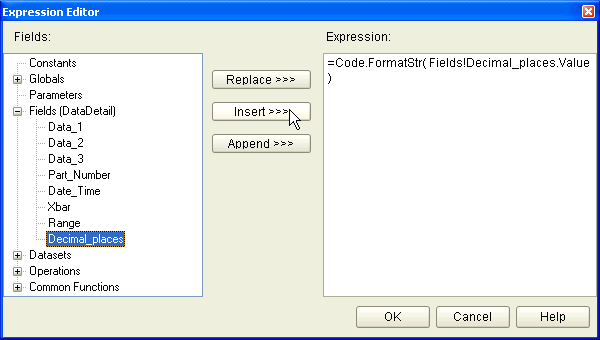
-
Click OK to paste this expression into the Format property for the textbox that displays the first data value ("Data_1").

-
Repeat these steps for the remaining data values ("Data_2", "Data_3", etc.).
Viewing the report and validating the result
Now we need to save the report, view the results, and make sure the results are correctly formatted according to the number of decimal places in the standard.
-
To save the report, click the  button. Alternately, you may click the File menu and then click Save Report.
-
To view the report, click the  button or click the File menu and then click View Report.
The report should display the name of the standard, the number of decimal places, and formatted data values for up to 10 subgroups for each standard you selected:
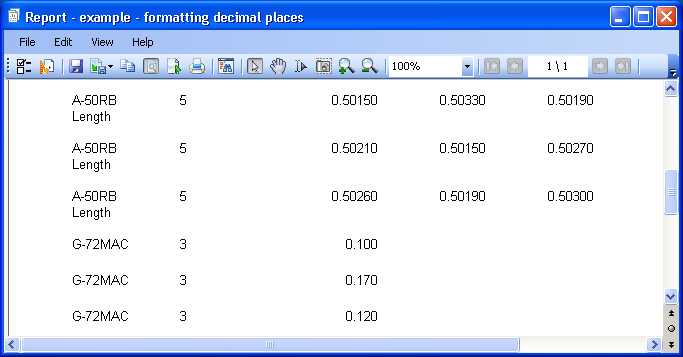
Other options
-
If you want to use this type of formatting in an Advanced report instead of an SPC report:
-
Your SQL query must SELECT the NUMDEC column from VSTDS and perform a join on the VSTDS and VDATA tables
-
You would format the data values using this NUMDEC column instead of the Decimal_places column.
-
To format a number to one more than the number of decimals set in the standard, you could add +1 to the parameter for the =Code.FormatStr command, such as:
=Code.FormatStr(Fields!Decimal_places.Value + 1)
-
For a number that is already a string (like any of the Statistics from your retrieval settings): if you want to apply a different numeric format to the value via the Format property, you also have to convert the string value to a number. You can do this by modifying the Value property.
For example, if your original Value was =First(Fields!Cp.Value) , you would modify the Value to be =ToDouble(First(Fields!Cp.Value)) .


![]() button to save the report, and then click the
button to save the report, and then click the ![]() button to view this draft of the report.
button to view this draft of the report.
![]() button to return to the Report Designer window.
button to return to the Report Designer window.


