Combining failures and good data in one monitor
|
 Note: This topic contains information about the legacy SPC Database Monitor module, which is being phased out from GainSeeker Suite. It is still available for use, but is being replaced by the Monitor Table chart window in the newer GainSeeker Charts module. Note: This topic contains information about the legacy SPC Database Monitor module, which is being phased out from GainSeeker Suite. It is still available for use, but is being replaced by the Monitor Table chart window in the newer GainSeeker Charts module.
|
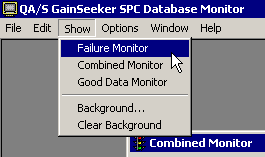
The Combined Monitor displays the most recent data record for each standard. You can use the Combined Monitor to see how all of your processes are running.
By default, data records with real-time failures are shaded red, and data records without real-time failures are shaded green. For more information on setting the colors for these records, see Customizing How Monitor Records are Displayed.
Starting the Combined Monitor

In , click the Window (or Wnd) menu, point to Show, and then click Combined Monitor.
More:
Launching the SPC Database Monitor
Monitoring Your Database
 Note: This topic contains information about the legacy SPC Database Monitor module, which is being phased out from GainSeeker Suite. It is still available for use, but is being replaced by the Monitor Table chart window in the newer GainSeeker Charts module.