Monitoring SPC real-time failures
|
 Note: This topic contains information about the legacy SPC Database Monitor module, which is being phased out from GainSeeker Suite. It is still available for use, but is being replaced by the Monitor Table chart window in the newer GainSeeker Charts module. Note: This topic contains information about the legacy SPC Database Monitor module, which is being phased out from GainSeeker Suite. It is still available for use, but is being replaced by the Monitor Table chart window in the newer GainSeeker Charts module.
|
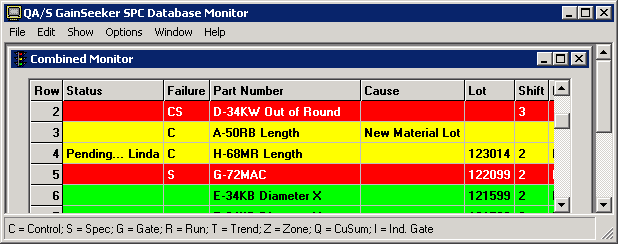
For real-time assessment of your variable data, use the SPC Database Monitor module. This module gives you real-time access to failures as soon as they occur.
Three views are available in the SPC Database Monitor:
-
Good Data Monitor
You can use the Good Data Monitor to see the standards for which the most recent data did not trigger any real-time failures. For details, see Monitoring good data.
-
Combined Monitor
You can use the Combined Monitor to see how all of your processes are running. For details, see Combining failures and good data in one monitor.

To start monitoring your database, see Launching the SPC Database Monitor.
Database Monitor setup for handheld devices
To set up your system for data monitoring in :
More:
Choosing which monitor records to display
Customizing how monitor records are displayed
Editing and deleting data in the monitor
Charting data from the monitor
Sending the monitor data to another program or file
 Note: This topic contains information about the legacy SPC Database Monitor module, which is being phased out from GainSeeker Suite. It is still available for use, but is being replaced by the Monitor Table chart window in the newer GainSeeker Charts module.