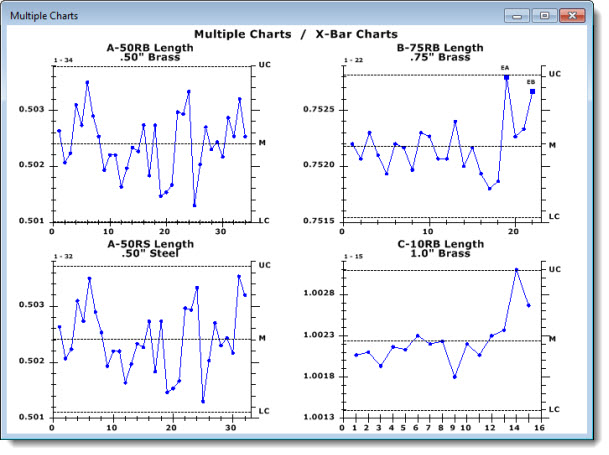
Use a Multiple Chart to display charts for multiple standards or retrievals in a single window.
You can choose which type of chart to display. See Multiple Chart type options for more information.
|
Contents [Hide] |

See Multiple Charts options for information.
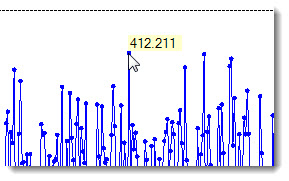
Click a data point to display the value for that point as shown in Fig. 1.
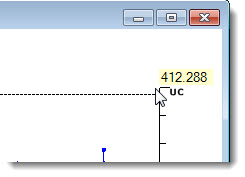
Click on the beginning or end of a limit line to display the value limit as shown in Fig. 2. This is a useful tool when you are working with grouped limits.
Fig. 1 Fig. 2
Because charts for up to 70 retrievals can be drawn in a multiple charts window, a few Settings tab options have been disabled for this chart type to avoid possible spatial issues. Settings options that can apply to any type of individual control chart, but not a summary chart, include:
Scroll data on the chart and the Show data grid on the chart options (including the scroll data and data grid chart header features for these options).
Draw individual data points for each subgroup setting option
Draw bar charts for subgroup and range values setting option
X-axis Label angle: (labels will display at zero degrees, regardless of the setting)
Label type will be by Count (not by date or a traceability) regardless of the setting
Limit labels: only two limits will display, regardless of the setting
 Note: Up to 70 retrievals can be shown in one window (up to 10 across and 7 high). Not all monitors support the 70 retrievals in a readable manner. You may have to limit the number of retrievals based on monitor hardware.