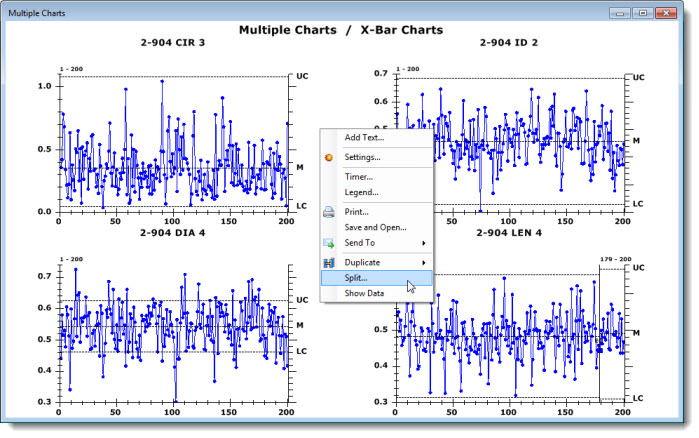
From a summary chart that contains multiple retrievals, you can generate new charts that analyze only the retrievals you choose.
Right-click a summary chart window, and then click Split... on the right-click menu that displays.

-or-
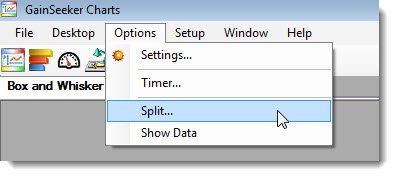
Click Options on the GainSeeker Charts menu bar. Then, click Split... on the list.

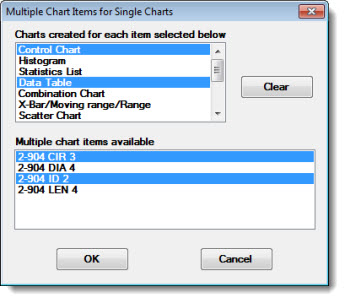
The Select Multiple chart Items for Single Charts dialog opens.

In the Charts created for each item selected below list, choose the types of individual charts you want to draw (if any) for each retrieval you selected. For example, if you select Data Table and Control Chart, GainSeeker will draw four charts: two Data Tables and two Control Charts (one chart of each type for 2904 CIR 3 and 2-804 ID 2.)
Click a chart type in the list to select it. Then, click and hold the CTRL (control) key while clicking on any other chart types you want to draw.
For optimized viewing of two or more charts, use the Tile function to automatically position the charts so they do not overlap.