Set options for defining and sorting rows and assign properties to columns for SPC and DMS data retrievals—on the same Dashboard Grid control—using the Define Grid Rows and Columns window.
|
Contents [Hide] |
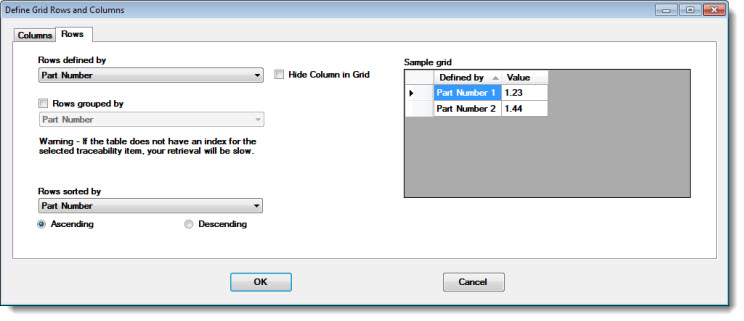
Use the Rows tab on the Define Grid Rows and Columns window to select options for defining and sorting rows on the Dashboard Grid.
The Sample grid on the Rows tab displays a representation of how various selections will display in the grid.
The Rows defined by setting determines how information will be divided into rows.
By default, each row on the Dashboard Grid displays information for one SPC standard or DMS standard.
However, you can change this to divide the rows by the values in one traceability field. For example, you might wish to display information for each Line - regardless of what parts are currently running on those lines.
When a Dashboard Grid includes a column for SPC data, this setting impacts how numbers are formatted and the speed of data retrieval:
If either Rows defined by or Rows grouped by (if used) is set to the SPC standard, then the default number of decimal places on each row is determined by the SPC standard for that row. This also applies to other windows such as Data Tables that were generated from such rows.
If neither Rows defined by nor Rows grouped by (if used) is set to the SPC standard, two special considerations apply:
If you have defined process specifications for the traceability values retrieved, then any information displayed on these rows will default to the settings from those process specifications (such as the number of decimal places and the Short Run coding method to calculate statistics across SPC standards). This also applies to other windows such as Data Tables that were generated from such rows.
When a process specification does not exist for one of these rows, no Short Run coding will be applied, and GainSeeker will by default use the number of decimal places that is set as the default for new SPC standards in the current configuration. This also applies to other windows such as Data Tables that were generated from such rows.
If you have not indexed this traceability field for Short Run, this dashboard may be very slow to retrieve data.
GainSeeker automatically adds the Rows defined by column to the grid.
However, you can hide this column if desired. For example, you may hide the column because the information that column will display is repetitive, such as when you filter for a single standard for the whole grid.
Hiding the column does not affect how data is retrieved or how statistics are calculated.
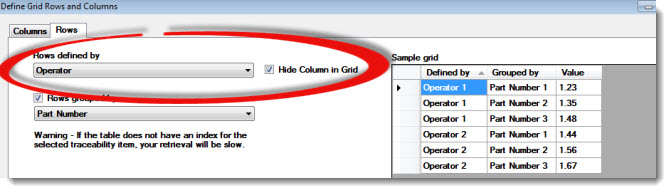
To hide the Rows defined by column on the grid, select the Hide Column in Grid check box.
Optionally, you can use the Rows grouped by property to further subdivide the rows on the Dashboard Grid.
If used, each row on the Dashboard Grid displays information for each unique combination of the Rows defined by and Rows grouped by values.
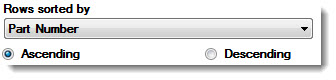
Sort rows in Ascending or Descending order to prioritize data for a single statistic or traceability label using the Rows sorted by drop-down list. (All other statistics and traceability fields will also sort accordingly.) The rows are sorted by Part Number by default if another priority is not set.
For more information, see How real-time failure rows are sorted.
To set the data priority:
Click the Rows sorted by list and select an option.
Select Ascending or Descending to sort the data values in ascending or descending order.
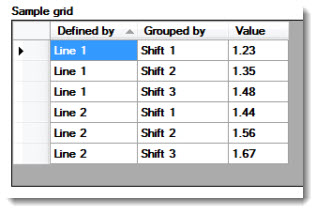
The Sample grid on the Rows tab displays a representation of how various selections will display in the grid.
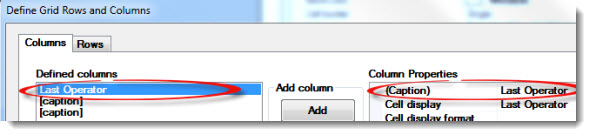
Use the Columns tab on the Define Grid Rows and Columns dialog to set retrieval options for the Grid columns.
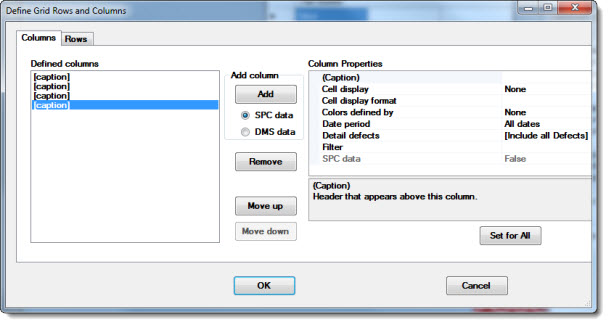
Click the Columns tab on the Define Grid Rows and Columns window.
Click the SPC data or DMS data options button![]() in the Add column field to assign that data type to a new column. Then, click Add.
in the Add column field to assign that data type to a new column. Then, click Add.
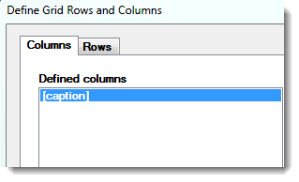
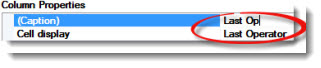
A highlighted bar representing the new column opens in the Defined columns list field with the word (caption):
The Column Properties grid on the Columns tab displays SPC or DMS data properties that can be edited for that column, depending on which retrieval was selected for it. See using property value cells for information on using value cells.
Repeat steps 1–2 above to add additional columns to the Defined columns list. The values for each column can be edited using the Column Properties grid on the Define Grid Rows and Columns dialog. See Editing the Column properties
To delete a column:
Click a column listing in the Defined columns list to select it.
Click the Remove button on the Define Grid Rows and Columns dialog.
The Move up and Move down buttons
Determine the order of the columns in the finished Grid using the Move up and Move down buttons on the Define Grid Rows and Columns dialog.
To change the position of a column in relation to other columns in the finished Grid (The top position in the Defined columns list represents the first column in the finished grid.):
Click a column listing in the Defined columns list to select it.
Click the Move up or Move down button until the column is correctly positioned in the list.
The Set for All button
Apply the same property value setting for one column to all or some of the other columns in the Dashboard Grid—depending on the data type—using the Set for All button on the Columns tab of the Define Grid Row and Columns dialog.
To use the Set for All button:
Click a column in the Defined columns list to select it for edit.
Click a property value cell in the Column Properties grid.
Edit the property value for that column (See Editing the Column Properties for more information.). Keep the property value cell selected (or click it to reselect it).
Click the Set for All button located below the Column Properties grid to apply that value to other columns in the finished Dashboard Grid.
Use the following table to determine which columns a property value will be copied to, based on the type of data in the source column:
|
|
This property from Source column can be copied to: |
||||||||
|---|---|---|---|---|---|---|---|---|---|
|
Source column |
(Caption) |
Cell display |
Cell display format |
Colors defined by |
Date period |
Detail defects |
Maximum data count |
Filter |
SPC data |
|
SPC DATA |
Both SPC and DMS columns |
Only SPC columns |
Both SPC and DMS columns |
Only SPC columns |
Both SPC and DMS columns |
exists only for DMS |
Only SPC columns |
Only SPC columns |
--- |
|
DMS DATA |
Both SPC and DMS columns |
Only DMS columns |
Both SPC and DMS columns |
Only DMS columns |
Both SPC and DMS columns |
Only DMS columns |
exists only for SPC |
Only DMS columns |
--- |
Use the Column Properties grid to set the statistic, defect process, caption, filter, date period, and other settings for a Grid column.
The selected column is highlighted in the list and any property values previously assigned to that column display in the Column Properties grid.
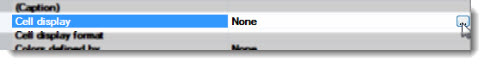
You can choose a statistic for which the selected column cells will retrieve data using the Cell display property.
 Note: Selecting one of these statistics: Sparkline, Chart, Chart (2x height), or Chart (4x height) from the list of available statistics displays a chart in each of the individual cells in the column. See Displaying charts in grid cells for more information.
To select a statistic:
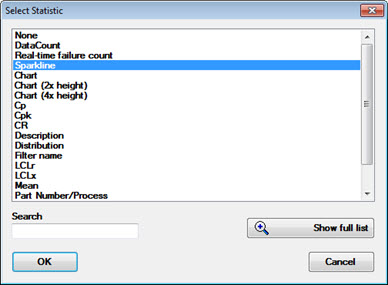
The Select Statistic dialog box opens, listing statistics for either SPC data or DMS data, depending on which data type was assigned to that column when it was added.
(Click the Show full list button to view all possible statistic labels. Click the Show short list button to revert back to the shorter list of options. Enter any part of a statistic name in the Search text field to limit the list to closer matches.)
A caption can now be added to the column. See editing the (Caption) property.
Note about [Detail] Statistics
 Most statistics display information for all defects found on each row of the statistical filter. This is true for all statistics except those statistics preceded by [Detail], which display information for only the selected defect. If you display a [Detail] statistic, the best practice is to add the name of the selected defect to the column caption.
Assign a caption to a column using the (Caption) property in the Column Properties grid on the Define Grid Rows and Columns dialog.
To assign a caption to a column:
Click a column in the Defined columns list on the Columns tab to select it.
To change the position of a column relative to other columns in the Grid, see Using the Move up and Move down buttons.
You can use this property to apply particular formatting to numeric values or date/time values displayed in a particular column on the Data Grid. For example, you could use this property to format one column's statistical value to two decimal places.
This property does not affect other windows that are generated from the Data Grid, such as Data Tables. For more information, see Rows defined by.
To set a Cell display format:
In the Defined columns list, click a column to select it.
In the Column Properties grid, click the Cell display format property. Then enter an appropriate Numeric format or Date/Time format.
Set the colors a column will display when the value cells in a column fail or pass a user-set filter with the Colors defined by property. Or set up color regions for a column. By default, the column cells have no color.
To set colors:
Click a column in the Defined columns list on the Columns tab to select it. Then, click the colors defined by property value cell. Then, click the ellipsis button ![]() in the value cell.
in the value cell.
![]()
The Column Display Colors dialog opens. See Using the Column Display Colors dialog
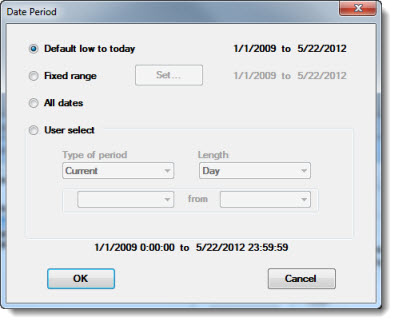
Set the date range so a column only retrieves data points that fall within the user-specified date range. Narrowing the date range can significantly shorten retrieval time. By default, the property is set to retrieve data for all date ranges.
To edit the Date range:
Click the Date period property value cell in the Column Properties grid. Then, click the ellipsis button ![]() in the value cell.
in the value cell.
![]()
The Date Period dialog opens. See Selecting the Date Range for Retrieval for general information on selecting a data range.
To assign a filter to a column retrieval:
Click the Filter property value cell. Then, click the ellipsis button ![]() in the value cell.
in the value cell.
![]()
The Select Filters dialog box opens. See Using the Select Filters dialog.
Restrict a column retrieval to only displaying a limited number of the most recent available SPC data records on the Dashboard Grid using this property. (A value of 0 displays all available records for that column on a Grid.)
To edit the property:
Click a column in the Defined columns list on the Columns tab to select it.
Click the Maximum data count property value cell text field. Select any numeric value in the text field. Then, enter a new numeric value.
![]()
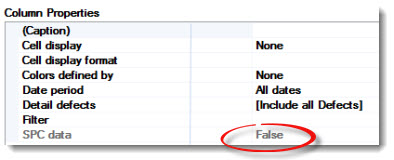
The column in the following example is set to display DMS data as indicated by the SPC data property value cell displaying the word False. If the selected (highlighted) column in the Defined columns list had been set to display SPC data, it would display the word True. The data type for a column is selected when a new column is added and cannot be changed to the other type once it is added.
Use the Detail defects property to specify defects that limit the analysis to the critical few for a comparison.
To edit this property:
Click the Select Defects property value cell. Then, click the ellipsis button ![]() in the value cell.
in the value cell.
The Select Defects dialog opens. See Using the Select Defects dialog.
![]()
Most statistics display information for all of the defects found on each grid row. This is true for all statistics except those preceded by [Detail]. These statistics only display meaningful information when a single defect is selected for the Detail defects property. If you display a [Detail] statistic, the best practice is to add the name of the selected defect to the column caption.
You can define colors to display on cells in the column, based on the value of each cell.
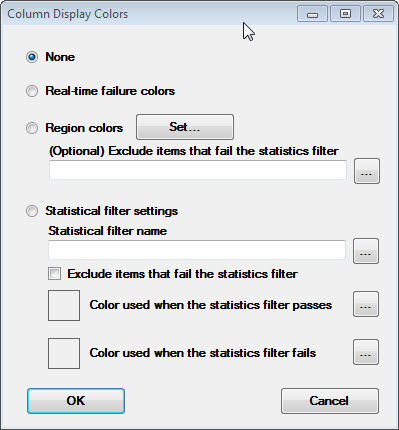
There are three ways to set colors:
for Real-time failures
using Region colors (with or without a Statistical Filter to exclude some data records from the grid)
using a Statistical filter with one or two colors (with or without the option to exclude some data records from the grid)
To select a Statistical filter:
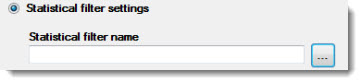
The Select Filters dialog opens. See Using the Select Filters dialog box below.
Create a new filter for a column or select, copy, or edit an existing filter using the Select Filters dialog. For more information, see Statistics filters and How statistics rows are filtered
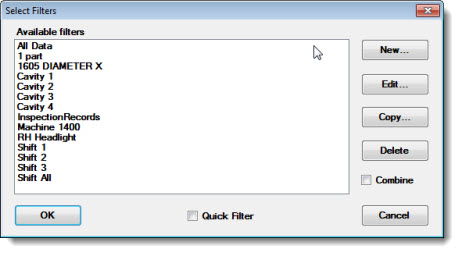
To select an existing filter:
Click a filter name in the Select a filter from the list field to select it for a column.
Click OK on the Select Filters dialog.
To create a new filter:
The Enter Value dialog opens.
Click the New filter name text field.
Enter a name for the new filter. Click OK.
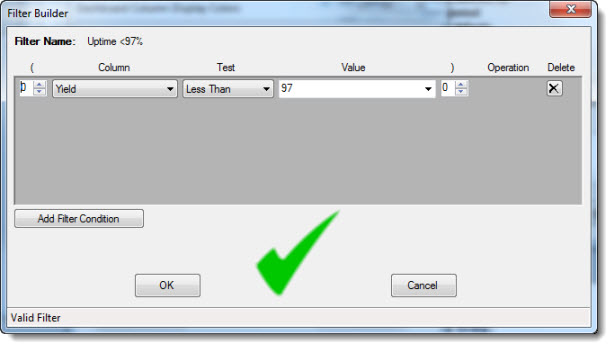
The Filter Builder dialog opens. See Setting the contents of a filter
To edit an existing filter:
The Filter Builder dialog opens. See Setting the contents of a filter
To copy an existing filter:
The Enter Value dialog opens.
Click the New filter name text field.
Enter a name for the new filter. Click OK.
The Filter Builder dialog opens. See Setting the contents of a filter
To combine filters:
Press and hold the CTRL key while you click the filters you want to combine.
Then, select the Combine checkbox.
Use the Filter Builder dialog to set filters and conditions for the retrieval in a column.
See Setting the contents of a filter for usage guidelines.
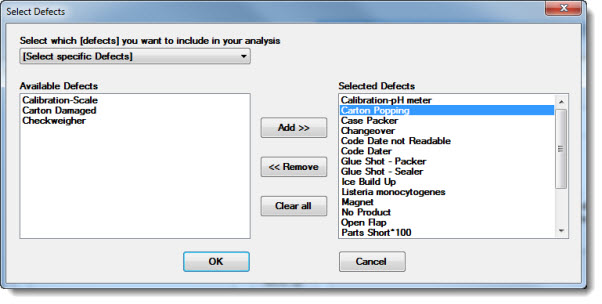
Use the Select Defects dialog to select specific defects to include in a column for comparison analysis. [Select all Defects] is the default setting. For more information, see Selecting Defects
Selecting Defects involves selecting (1) a defect process group, and (2) whether to include all the defects associated with that group or select individual defects in the retrieval.
To select a defect group :
Click a defect group in the drop-down list or leave it set to [Include all Defects] (you can remove unwanted defects from the latter setting) to select it for a column.
Individual defects that are included in the selected group display in the Selected Defects list. Other available individual defects display in the Available Defects list.
Use the Add >> and << Remove buttons to select or deselect individual defects for the analysis.
The Select which [defects] you want to include in your analysis drop-down list displays the [Select specific Defects] after any changes are made.
Click OK on the Select Defects dialog.