-
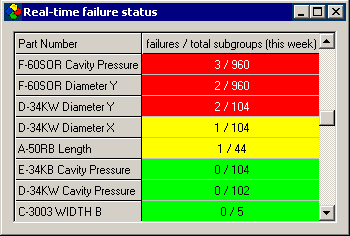
Real-time failure dashboards

This type of dashboard is available only for variable SPC data.
In many ways it is similar to the SPC Database Monitor module, because it helps you display information based on the real-time failure status of your process characteristics. However, the real-time failure dashboard also makes it easy to display the statistics and text items you choose and compare the real-time failure status across multiple time periods.
For more information, see Designing a dashboard for real-time failures. -
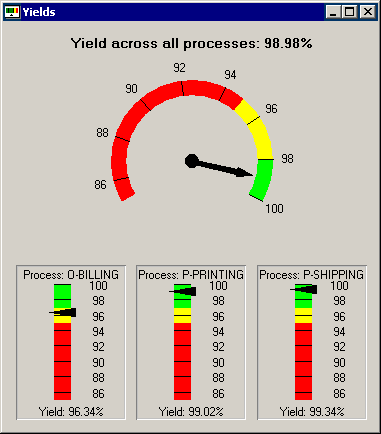
Key Process Indicator (KPI) gage dashboards

This type of dashboard is available for both variable (SPC) and attribute (DMS) data.
It allows you to customize a dashboard window with gages and/or updatable text for each key statistic that you specify. You can also use these gages to communicate whether the statistic falls within an acceptable range or indicates a problem within your process. Additionally, your KPI gage dashboard can include pictures, documents, web pages, and static text.
For more information, see Dashboards for Key Process Indicator gages. -
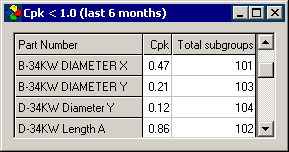
Statistical Filter dashboards

This type of dashboard is available for both variable (SPC) and attribute (DMS) data.
It allows you to search across your processes for data that meets a statistical criterion – such as characteristics with Cpk < 1.0 or processes with Yield < 90%.
For more information, see Dashboards for statistical filters.