 Note: Default
Reports settings and all other settings located in the Chart overrides
node of the Settings dialog can be saved as a chart skin that you can
apply to any charts. For more information, see Chart
Skins
Note: Default
Reports settings and all other settings located in the Chart overrides
node of the Settings dialog can be saved as a chart skin that you can
apply to any charts. For more information, see Chart
SkinsUse the Default Reports options on the Settings tab to select statistics and other information to display with a chart.
Note: Default
Reports settings and all other settings located in the Chart overrides
node of the Settings dialog can be saved as a chart skin that you can
apply to any charts. For more information, see Chart
Skins
System administrators can assign default settings to charts in the GainSeeker System Administration module. See Chart Defaults settings
|
Contents [Hide] |
Navigate to the Default Reports settings following this path on the Settings tab:
Chart overrides | Charts | Default reports
Select information to display on an optional grid header.
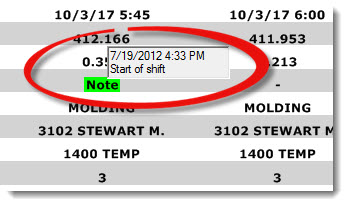
Display multiple statistics and traceability values on a grid above a chart, including one-click, info-tips for Notes at individual data points as shown in this example.
Add or change the columns in a Data Table.
Add or change the columns in a Monitor Table.
Add or change the columns in a Multiple-standard Data Table.
Select the statistics report for a Statistics list.
Select the statistics table report name for a Statistics table.
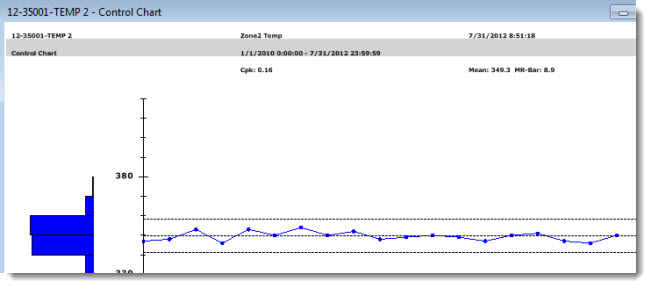
Select statistics to display beneath a chart on your computer screen and on a printed chart. You can also opt to print a chart without the statistics.
Select statistics to display beneath a Combined Control Chart on your computer screen and on a printed chart.
Select statistics to display beneath a Data Table on your computer screen and on a printed data table. You also can opt to print a chart without the statistics.
Select statistics to display beneath a multiple capability chart on your computer screen and on a printed multiple capability chart. You can also opt to print a chart without the statistics. This setting applies to Process Capability charts, including: Histogram, Box, Centered Box, and Box and Whisker.
Select statistics to display beneath a Performance chart on your computer screen and on a printed Performance chart. You can also opt to print a chart without the statistics.