This tutorial helps you use the sample data set to create a Certificate of Analysis for five characteristics that were measured at the same time:
|
Contents [Hide] |
To follow the steps of this tutorial, you must have the sample data set installed. For more information, see Installing sample data.
Launch the Dynamic Reports module and log in as "Tour Manufacturing".
On the SPC Reports tab, click New Report.
Enter a name for the report – such as "COA for 12-35001" – and then click OK.
This will display the Report Retrieval Settings screen with the Part Number tab selected.
On the Part Number tab, select all of the standards for part number 12-35001. For help, see Finding and selecting standards.
On the Statistics tab, select the statistics Cp, Cpk, Mean, Part Number/Process and R-Bar.
For this report, the Advanced button on this screen should be green. If not, click Advanced and then click Put statistics in separate table.
For help, see Choosing the statistics.
On the Settings tab, right-click the Maximum count for retrieval and set it to 25.
On the Columns tab, select Part Number, Date/Time and X-bar. For help, see Choosing the Columns.
To save the work you have performed so far, click the ![]() button. Alternately, you may click the File
menu and then click Save Report.
button. Alternately, you may click the File
menu and then click Save Report.
To begin designing the report, click Design Report.
To add a header section to the report, click the Report menu and then click Page Header.
Add the title to the header:
In the upper half of the Toolbox, click on TextBox.
In the Page Header section of the layout area, click on the point where the upper left corner of the title box should be placed - for example, at the top of the page header near the 3-inch mark.

This will create a blank text box at the point where you clicked:

While the textbox is selected (as shown in the picture above), you can:
type the title that will be displayed at the top of the report - for example, "Certificate of Analysis"
click the ![]() button to italicize the title and the
button to italicize the title and the ![]() button to increase the font size to 28pt
button to increase the font size to 28pt
click on a drag handle on the right-hand side of the textbox and drag it wide enough to accommodate the title - for example, to the 7-inch mark
click on a drag handle on the bottom of the textbox and drag it down to accommodate the title

You may also notice that as you make changes in the layout area, many of those changes are reflected in the properties grid.
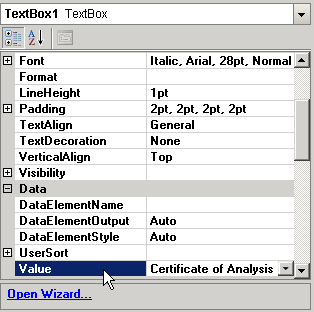
To save the work you have performed so far, click the ![]() button. Alternately, you may click the File
menu and then click Save Report.
button. Alternately, you may click the File
menu and then click Save Report.
Add the logo to the header:
Click and drag the Image item from the upper half of the Toolbox to the Page Header section of the layout area, and drop it at the point where the upper left corner of the logo should be placed.

This will create a blank image placeholder at the point where you clicked:
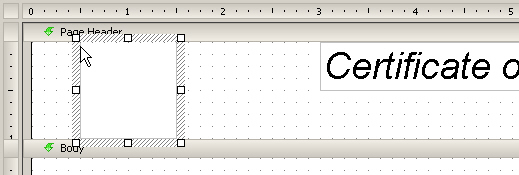
Embed the logo file in the report:
On the lower half of the Toolbox, click the ![]() button and then click Embedded Image.
button and then click Embedded Image.
On the Open screen, browse to the folder that contains your sample data files and click the file named "diamond.bmp". Then click OK.
This adds diamond to the Embedded Images tree in the lower half of the Toolbox:
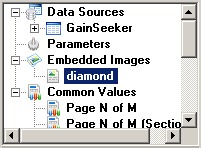
Right-click the image placeholder and then click Properties. This will display the Image Smart Panel.
On the Image Smart Panel, click General or click the ![]() button.
button.
On the Image - General screen, change the Image Source to Embedded. Then click the Image Value list and select diamond.
Click Accept to close this Smart Panel. The logo is now displayed inside the image placeholder:
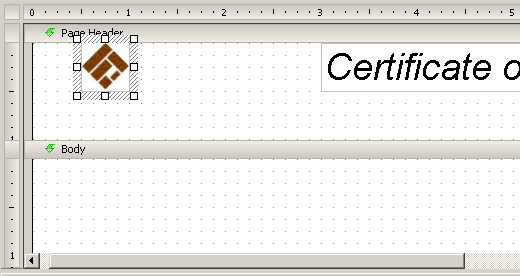
To save the work you have performed so far, click the ![]() button. Alternately, you may click the File
menu and then click Save Report.
button. Alternately, you may click the File
menu and then click Save Report.
To add a footer section to the report, click the Report menu and then click Page Footer.
To add page numbers to the report footer, click and drag the Common Values \ Page N of M item from the lower half of the Toolbox to the Page Footer section of the layout area, and drop it at the point where the upper left corner of the page number textbox should be placed.
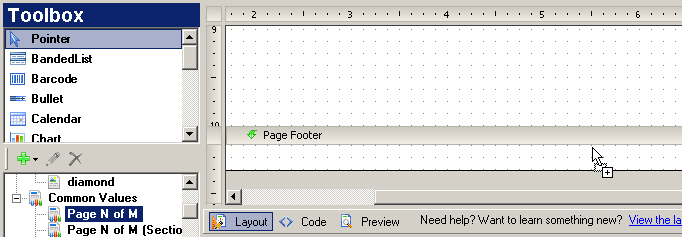
This will add a page number field to the Page Footer area:

To save the work you have performed so far, click the ![]() button. Alternately, you may click the File
menu and then click Save Report.
button. Alternately, you may click the File
menu and then click Save Report.
This report will use a Matrix to display the subgroup average for each characteristic at each date and time when data was collected. For more information on using this type of data region, see Matrix.
Add a matrix to the body of the report:
In the upper half of the Toolbox, click on Matrix.
In the Body section of the layout area, click on the point where the upper left corner of the matrix should be placed - for example, at the top left corner of the body.
This will create a blank matrix at the point where you clicked:
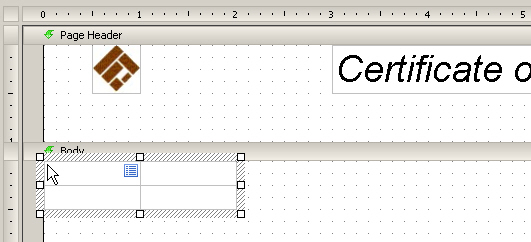
Add data to the matrix:
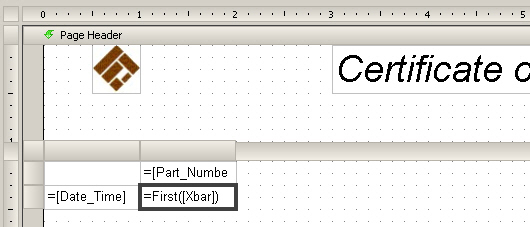
Click and drag the Data Sources \ GainSeeker \ DataDetail \ Date_Time item from the lower half of the Toolbox and drop it in the lower left cell on the matrix.
Click and drag the Data Sources \ GainSeeker \ DataDetail \ Part_Number item from the lower half of the Toolbox and drop it in the upper right cell on the matrix.
Click and drag the Data Sources \ GainSeeker \ DataDetail \ Xbar item from the lower half of the Toolbox and drop it in the lower right cell on the matrix.
You matrix should now look like this:
To save the work you have performed so far, click the ![]() button. Alternately, you may click the File
menu and then click Save Report.
button. Alternately, you may click the File
menu and then click Save Report.
To view the report in its present state, click the ![]() button. Alternately, you may click the File
menu and then click View Report.
button. Alternately, you may click the File
menu and then click View Report.
Your report probably looks something like this:
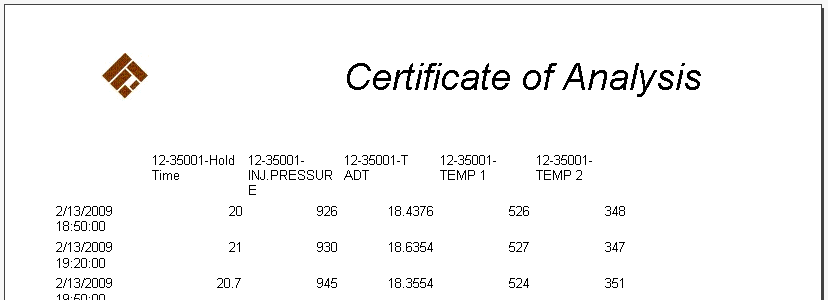
Several modifications would make this report look better:
centering the values in the data columns
displaying the data values to a consistent number of decimal places
displaying the column headers (names of the standards) in bold
widening the columns to minimize text wrapping
To return to the Report Designer screen, click the ![]() button. Alternately, you may click the File
menu and then click Design Report.
button. Alternately, you may click the File
menu and then click Design Report.
Click any cell in the matrix to activate the matrix controls. Then select the second column of the matrix by clicking its gray header bar.
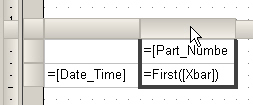
Now click the ![]() button to center the selected items.
button to center the selected items.
To save the work you have performed so far, click the ![]() button. Alternately, you may click the File
menu and then click Save Report.
button. Alternately, you may click the File
menu and then click Save Report.
To view the report in its present state, click the ![]() button. Alternately, you may click the File
menu and then click View Report.
button. Alternately, you may click the File
menu and then click View Report.
The data columns should now be centered on the report like the example below:

To return to the Report Designer screen, click the ![]() button. Alternately, you may click the File
menu and then click Design Report.
button. Alternately, you may click the File
menu and then click Design Report.
The lower right cell of the matrix you have configured is used to display the numeric data values.
Click the lower right cell on the matrix.
On the property grid, click the Appearance \ Format property.
Click the drop-down arrow for the Appearance \ Format property and choose the option "1234.00". This will enter the letter F in the Appearance \ Format property.
Alternately, you may type the number 0.00 in the Appearance \ Format property.
To save the work you have performed so far, click the ![]() button. Alternately, you may click the File
menu and then click Save Report.
button. Alternately, you may click the File
menu and then click Save Report.
To view the report in its present state, click the ![]() button. Alternately, you may click the File
menu and then click View Report.
button. Alternately, you may click the File
menu and then click View Report.
The data values should now be displayed to two decimal places like the example below:

To return to the Report Designer screen, click the ![]() button. Alternately, you may click the File
menu and then click Design Report.
button. Alternately, you may click the File
menu and then click Design Report.
The upper right cell of the matrix you have configured is used to display the column headers (the names of the standards).
Click the upper right cell on the matrix.
Click the ![]() button. Alternately, you may expand the Appearance \ Font property on the properties grid and then change the FontWeight sub-property to Bold.
button. Alternately, you may expand the Appearance \ Font property on the properties grid and then change the FontWeight sub-property to Bold.
Click any cell in the matrix to activate the matrix controls. To change the width of either column on the matrix, click and drag the right-hand side of the gray header cell at the top of that column. Save and view your changes, then return to the Report Designer screen and repeat this step as needed to expand the columns so that text wrapping is limited, like the example below.

This report will use a Matrix to display the summary statistics that have been calculated for each characteristic. It will use additional rows to display multiple statistics for each standard. For more information on using this type of data region, see Matrix.
Add another matrix to the body of the report:
In the upper half of the Toolbox, click on Matrix.
In the Body section of the layout area, click on the point where the upper left corner of the matrix should be placed - for example, just below the existing matrix that displays the date/time stamps and subgroup averages.
This will create a blank matrix at the point where you clicked:
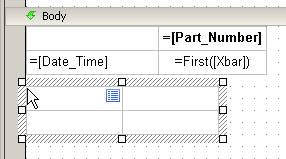
Add information from the Statistics dataset to the matrix:
Click and drag the Data Sources \ GainSeeker \ Statistics \ Part_Number_Process item from the lower half of the Toolbox and drop it in the upper right cell on the matrix.
Click and drag the Data Sources \ GainSeeker \ Statistics \ Cpk item from the lower half of the Toolbox and drop it in the bottom right cell on the matrix.
Add the other three statistics to this matrix:
Right-click the bottom right cell on the matrix and then click Add Row.
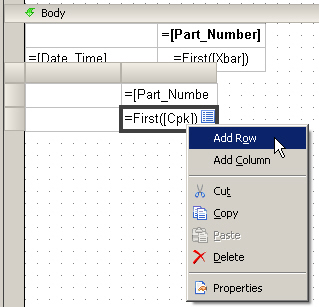
Click and drag the Data Sources \ GainSeeker \ Statistics \ Cp item from the lower half of the Toolbox and drop it in the bottom right cell on the matrix.
Repeat these steps for the Mean and RBar statistics.
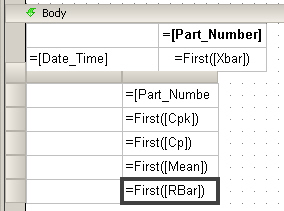
To save the work you have performed so far, click the ![]() button. Alternately, you may click the File
menu and then click Save Report.
button. Alternately, you may click the File
menu and then click Save Report.
Apply row labels to the statistics reported by the matrix:
Click in the empty cell to the left of the field that reports the Cpk statistic. Type "Cpk" in this cell and apply bold formatting to the cell.
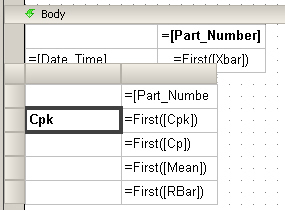
Click in the empty cell to the left of the field that reports the Cp statistic. Type "Cp" in this cell and apply bold formatting to the cell.
Click in the empty cell to the left of the field that reports the Mean statistic. Type "Average" in this cell and apply bold formatting to the cell.
Click in the empty cell to the left of the field that reports the R-Bar statistic. Type "Range" in this cell and apply bold formatting to the cell.
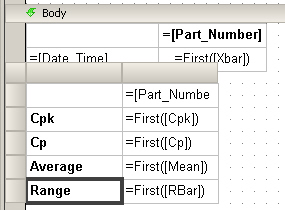
To save the work you have performed so far, click the ![]() button. Alternately, you may click the File
menu and then click Save Report.
button. Alternately, you may click the File
menu and then click Save Report.
Expand the columns to match the Data Grid above:
Click any cell in the matrix to activate the matrix controls. To change the width of either column on the matrix, click and drag the right-hand side of the gray header cell at the top of that column.
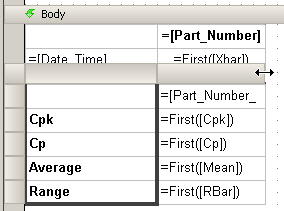
To save the work you have performed so far, click the ![]() button. Alternately, you may click the File
menu and then click Save Report.
button. Alternately, you may click the File
menu and then click Save Report.
Center the values in the statistics columns:
Click any cell in the matrix to activate the matrix controls. Then select the second column of the matrix by clicking its gray header bar.
Now click the ![]() button to center the selected items.
button to center the selected items.
To save the work you have performed so far, click the ![]() button. Alternately, you may click the File
menu and then click Save Report.
button. Alternately, you may click the File
menu and then click Save Report.
To view the report in its present state, click the ![]() button. Alternately, you may click the File
menu and then click View Report.
button. Alternately, you may click the File
menu and then click View Report.

To return to the Report Designer screen, click the ![]() button. Alternately, you may click the File
menu and then click Design Report.
button. Alternately, you may click the File
menu and then click Design Report.
If desired, you can hide the names of the standards at the top of the statistics grid, since they match the headers at the top of the data grid above:
Click the top right cell of the matrix.
On the properties grid, expand the Appearance \ Visibility property and change the Hidden property to True.
To save the work you have performed so far, click the ![]() button. Alternately, you may click the File
menu and then click Save Report.
button. Alternately, you may click the File
menu and then click Save Report.
To view the report in its present state, click the ![]() button. Alternately, you may click the File
menu and then click View Report.
button. Alternately, you may click the File
menu and then click View Report.