OEE Retrieval Prerequisites
There are a few simple tasks you need to perform before you can retrieve meaningful OEE (Overall Equipment Effectiveness) data.
Be sure to complete each of these detailed in this topic.
1. Designate OEE traceability fields
Before drawing OEE charts, you will need to designate five new traceability fields (columns) in which to store the raw data values used to determine your OEE.
See Adding traceability field labels
-
Select five consecutive traceability fields (for example, fields 6–10) that are not previously used, and
-
Assign a label to each of those traceability fields in this order:
Available Time
Scheduled Time
#Good Parts
#Total Parts
Ideal Cycle Time
2. Change an OEE Statistic setting in the GainSeeker System Administration module
After you have designated the new OEE traceability fields (columns) as detailed in step 1. above, you will need to set the First of five traceability columns where OEE values are stored = setting.
-
Follow this path on the GainSeeker System Administration module to access the setting:
Configurations tab | configuration name | Statistics | OEE | First of five traceability columns where OEE values are stored =
-
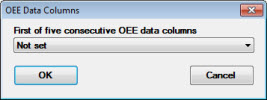
Right-click the setting to open the OEE Data Columns dialog.
The default setting is Not set; OEE calculations are disabled.

-
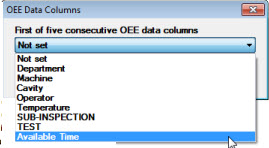
To enable OEE calculations for your data, select the Available Time traceability label (you added in step 1 above) from the drop-down list. Then, click OK.

3. Select the start of work day time and shift sequence
You can group data for OEE charts (and DPU charts) by work shifts within a specified 24-hour period for up to three shifts: three 8-hour shifts, two 12-hour shifts, or one 24-hour "shift."
The Shift Sequence= and Start of work day= settings are to used to determine how GainSeeker groups your data for your typical workday.
 It is important that you use these settings to keep your data associated with the correct workday, especially if any of your shifts span two days (for example, if your Shift3 starts at 11pm and ends 7am the following day).
4. Select a default time increment or traceability by which to group data
You can group data on OEE charts (and DPU charts) by one of many time increments or traceabilities, including shift, which groups shift data by day.
5. Enter OEE Data
Use one of the many GainSeeker data entry options - PC Collect, SPC Data Entry, DMS Data Entry, etc. - to enter OEE data for analysis.
The OEE data you enter must meet the following requirements:
 Note: The examples for Available Time, Schedule Time, and Ideal Cycle Time provided in the topics OEE Availability, OEE Performance, and OEE Quality, are shown in minutes. You can use any time interval you want such as hours or seconds. However, to ensure accurate data, you must use the specific time increment you select consistently across the Available Time, Schedule Time, and Ideal Cycle Time values.
Get started drawing OEE charts


 It is important that you use these settings to keep your data associated with the correct workday, especially if any of your shifts span two days (for example, if your Shift3 starts at 11pm and ends 7am the following day).