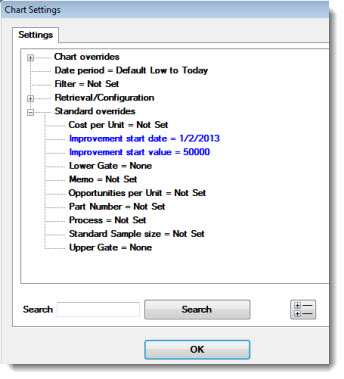
 Note: DPU settings and all other settings in the Chart overrides node on the Settings dialog can be saved as a chart skin. See Chart Skins for more information.
From an open DPU chart, you can quickly apply an improvement start date and start value that you have defined for any process to some retrievals. This task can be quickly accomplished using the Select DPU start date and value dialog.
 Note: DPU settings and all other settings in the Chart overrides node on the Settings dialog can be saved as a chart skin. See Chart Skins for more information.
|
Contents [Hide] |
For information about Setting an improvement start date and improvement start value for a process see below.
For information about Changing an improvement start date and improvement start value for a process see below.
To open the Select DPU start date and value dialog:
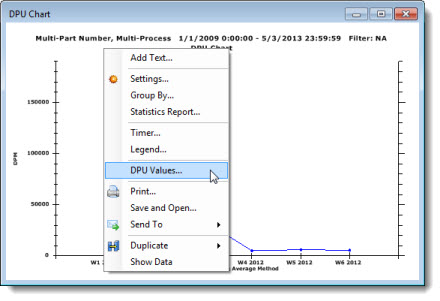
The Select DPU start date and value dialog opens, displaying all of the processes for which improvement start dates and improvement start values have previously been defined (including processes not selected in the retrieval for the current chart). The word "Retrieved" displayed in the Data column indicates a process that is included in the current retrieval.
Click any process in the list if you want to display the improvement line for that process on the current DPU chart. If you select a process that is not part of the current retrieval, this will display only the improvement line. It will not retrieve the data for that process.
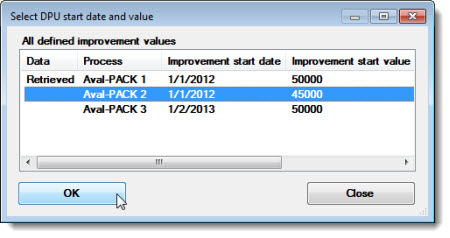
Click OK.
The following informational dialog box may display asking if you want to display the improvement line on the chart.
(If you preselected the Draw improvement line on a DPU chart checkbox setting on the New DMS Charts dialog Settings tab, this will not display.)
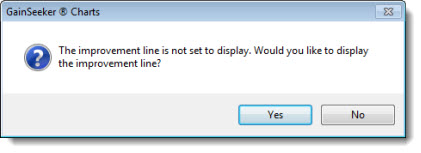
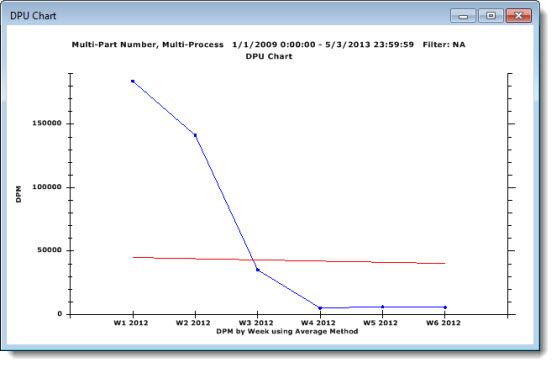
The improvement line for the selected process displays on the chart along with the retrieval for the original processes you selected when you created the chart.
For information about setting the Improvement Start Date and Improvement Start Value for a process, see DMS Processes
To change the Improvement Start Date and Improvement Start Value of a process from an open DPU chart:
Right-click the chart. Select Settings... from the menu that displays.
Then, change the values for these settings on the Settings tab of the Chart Settings dialog that opens.
